

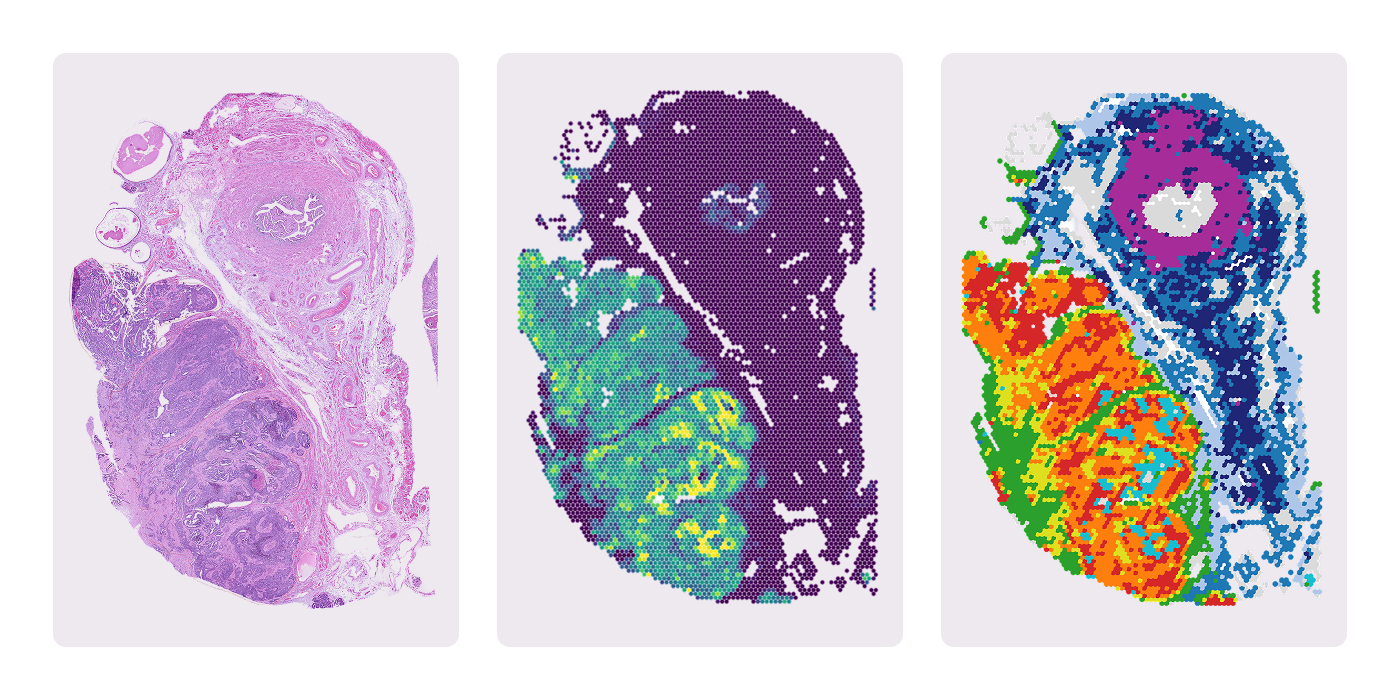
Blog - September 24, 2026
From Model to Patient: M-Optimus-1 for Spatial Biomarker Discovery in Ovarian Cancer
Bioptimus is building a world model for biology. M-Optimus-1 is our first iteration toward that goal, and our last post showed what it can see: the molecular geography of a tumor, decoded from a slide alone. This post asks the next question. So what does that mean for clinical R&D. We show how M-Optimus-1 turns archived cohorts into a search space for biomarkers, and what it found in ovarian cancer.
TL;DR:
minimize
Most biomarker research looks for a single signal: one gene, one protein, one mutation. A single biomarker rarely explains why a patient responds or resists treatment, because tumor behavior is shaped by the surrounding tissue, the patient’s overall biology, as much as by the cancer cell itself.
That surrounding tissue, the tumor microenvironment, can be captured with spatial data. M-Optimus-1 infers this spatial data directly from a routine H&E slide, without requiring a new, expensive assay. This means pharma and researchers can study how multiple signals combine in the tumor microenvironment, rather than looking at one signal in isolation.
We tested this approach on ovarian cancer. Here is what we found:
- M-Optimus-1 accurately reconstructs spatial gene expression from H&E alone. Its predictions matched lab-measured ground truth at r=0.81 on a slide it never saw during training.
- Resistant tumors showed a specific spatial pattern. VEGFA+ tumor cells sitting next to cancer-associated fibroblasts were found to be associated with resistance (p=0.003).
- Non-responders did not form one uniform group. Hierarchical clustering split them into distinct TME subtypes, each pointing to a different combination treatment strategy.
Combining multiple biomarkers with TME context predicted patient response more accurately than any single marker alone. This is what could enable better diagnostics and new treatment strategies, built on cohorts pharma companies already have.
Introduction
Cancer treatment has historically been guided by broad molecular profiling under the assumption that the dominant signal is carried by the malignant cells themselves. Assays like somatic mutations, bulk gene expression and histopathology provide comprehensive overviews on how genetic alterations drive cellular behavior and tissue-level changes in oncology1. However, cells in the tumor are spatially organised and form functional units which are heterogenous not only across patients but even within the same tumor. A tumor may assemble an immunosuppressive shield of tumor-supporting stromal and immune cells and a supporting vascular and metabolic niche that together enable it to survive therapy. Those findings reconceptualize cancer as a disease of the microenvironmental ecosystem. Further, recent insights underscore the tumor microenvironment (TME) as a master regulator of carcinogenesis, drug resistance, and immune evasion2. Consequently, modern targeted treatment regimens are increasingly designed to dual-target cell-intrinsic oncogenic drivers alongside microenvironmental support networks, neutralizing TME-mediated drug resistance. Mastering the TME is critical to breaking this therapeutic resistance, signaling a definitive move toward TME-focused and tailored cancer medicine.
We recently released M-Optimus-1, our first iteration of a world model of biology. In our previous release, we focused on the performance metrics behind M-Optimus-1 as well as the scaling laws we observed while training M-Optimus-1. The latter provides one of our main motivations for starting our data initiative STELA scaling spatial discoveries to one hundred thousand patients.
In this release, we discuss how to use M-Optimus-1 for spatial biomarker discovery on historical cohorts in ovarian cancer. In the US, Ovarian cancer is to-date the sixth leading cause of cancer death in women3. September is Ovarian cancer awareness month, hence we leverage a historical cohort to showcase how M-Optimus-1, in principle, changes the analysis of large retrospective patient cohorts by enriching them with spatially resolved molecular gene expression profiles. We specifically leverage M-Optimus-1 to detect niches relevant for cancer treatment based on M-Optimus-1-inferred spatial transcriptomics signature. Additionally, we show how those can guide spatial biomarker discovery to stratify patients based on their TME differences inferred by the model. M-Optimus-1 turns the biomedical landscape from “bench to patient” into “from model to patient”.
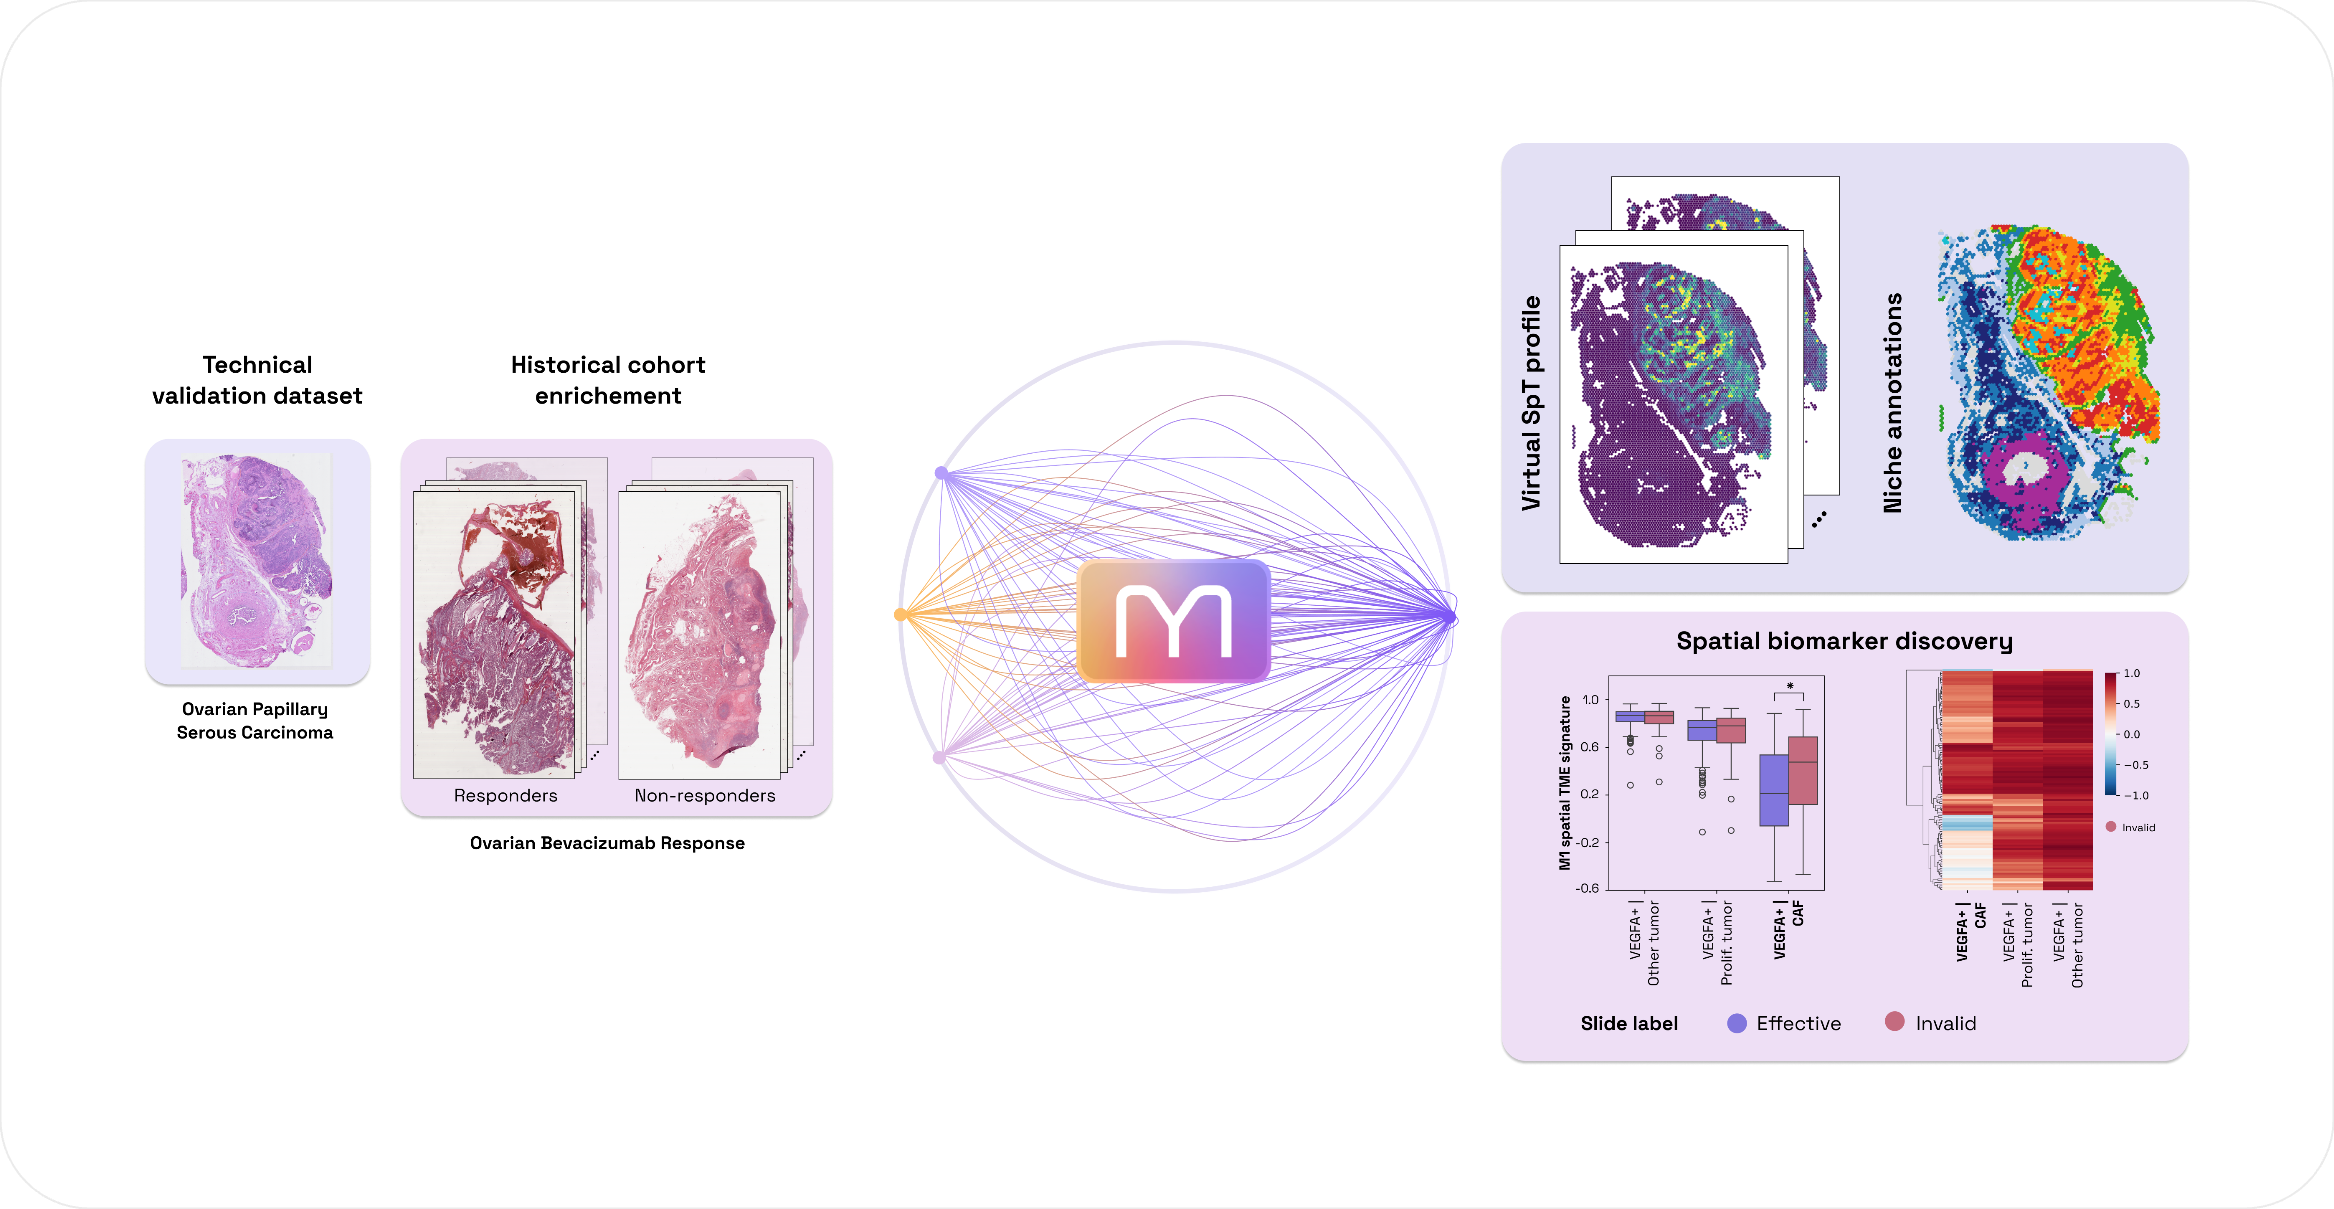
M-Optimus-1 correctly infers spatial biology in the TME from H&E and bulk-RNA-seq alone
Using M-Optimus-1 as an accelerator pipeline for spatial biomarker discovery, requires an initial evaluation that spatial gene expression profiles inferred by M-Optimus-1 correctly mimic a ground truth measurement. For this evaluation, we leverage a dataset measuring a patient diagnosed with ovarian papillary serous carcinoma (stage III-B; T3B N0 MX)4.
Deep Dive: Ovarian Papillary Serous Carcinoma
The slide we discuss in this first part of the blog post contains a patients’ tumor staged as III-B (T3B N0 MX)4. This tumor has spread to the abdomen (TB3), but not yet into the lymph nodes (N0); due to missing information, it is unclear whether the tumor has developed metastasis in distant sites (MX). The standard-of-care in ovarian cancer is currently still primary cytoreductive surgery followed by platinum-taxane chemotherapy which achieves complete clinical remission in up to ~75% of patients. However, the majority of responders relapse within 18-28 months and five-year survival remains ~20-40%5. Anti-angiogenic agents, like bevacizumab, have emerged as a highly promising treatment strategy as second-line and first-line therapy6,7. Further, bevacizumab-containing regimens (including combinations with antibody-drug conjugates, e.g. FORWARD II, NCT02606305; GLORIOSA, NCT05445778) are of active clinical interest8.
This technical validation dataset contains both a scRNA-seq profile of the tissue as well as an adjacent slide measured with 10x Genomics Xenium Prime (Fig. 2A). M-Optimus-1 is trained on H&E and bulk RNA-seq, hence, we pseudo-bulk the single-cell measurement to be compliant with the required model inputs. Both measurements were not encountered during the training of M-Optimus-1. We apply M-Optimus-1 in multimodal-inference mode on the pseudo-bulked expression vector and the Post-Xenium H&E to predict the spatial gene expression profile across 6,000 genes. To assess whether M-Optimus-1 captures the specific molecular subtypes relevant in ovarian cancer treatment resistance, we evaluate the model's performance aggregated by molecular subtypes dominantly present in the main tumor area.
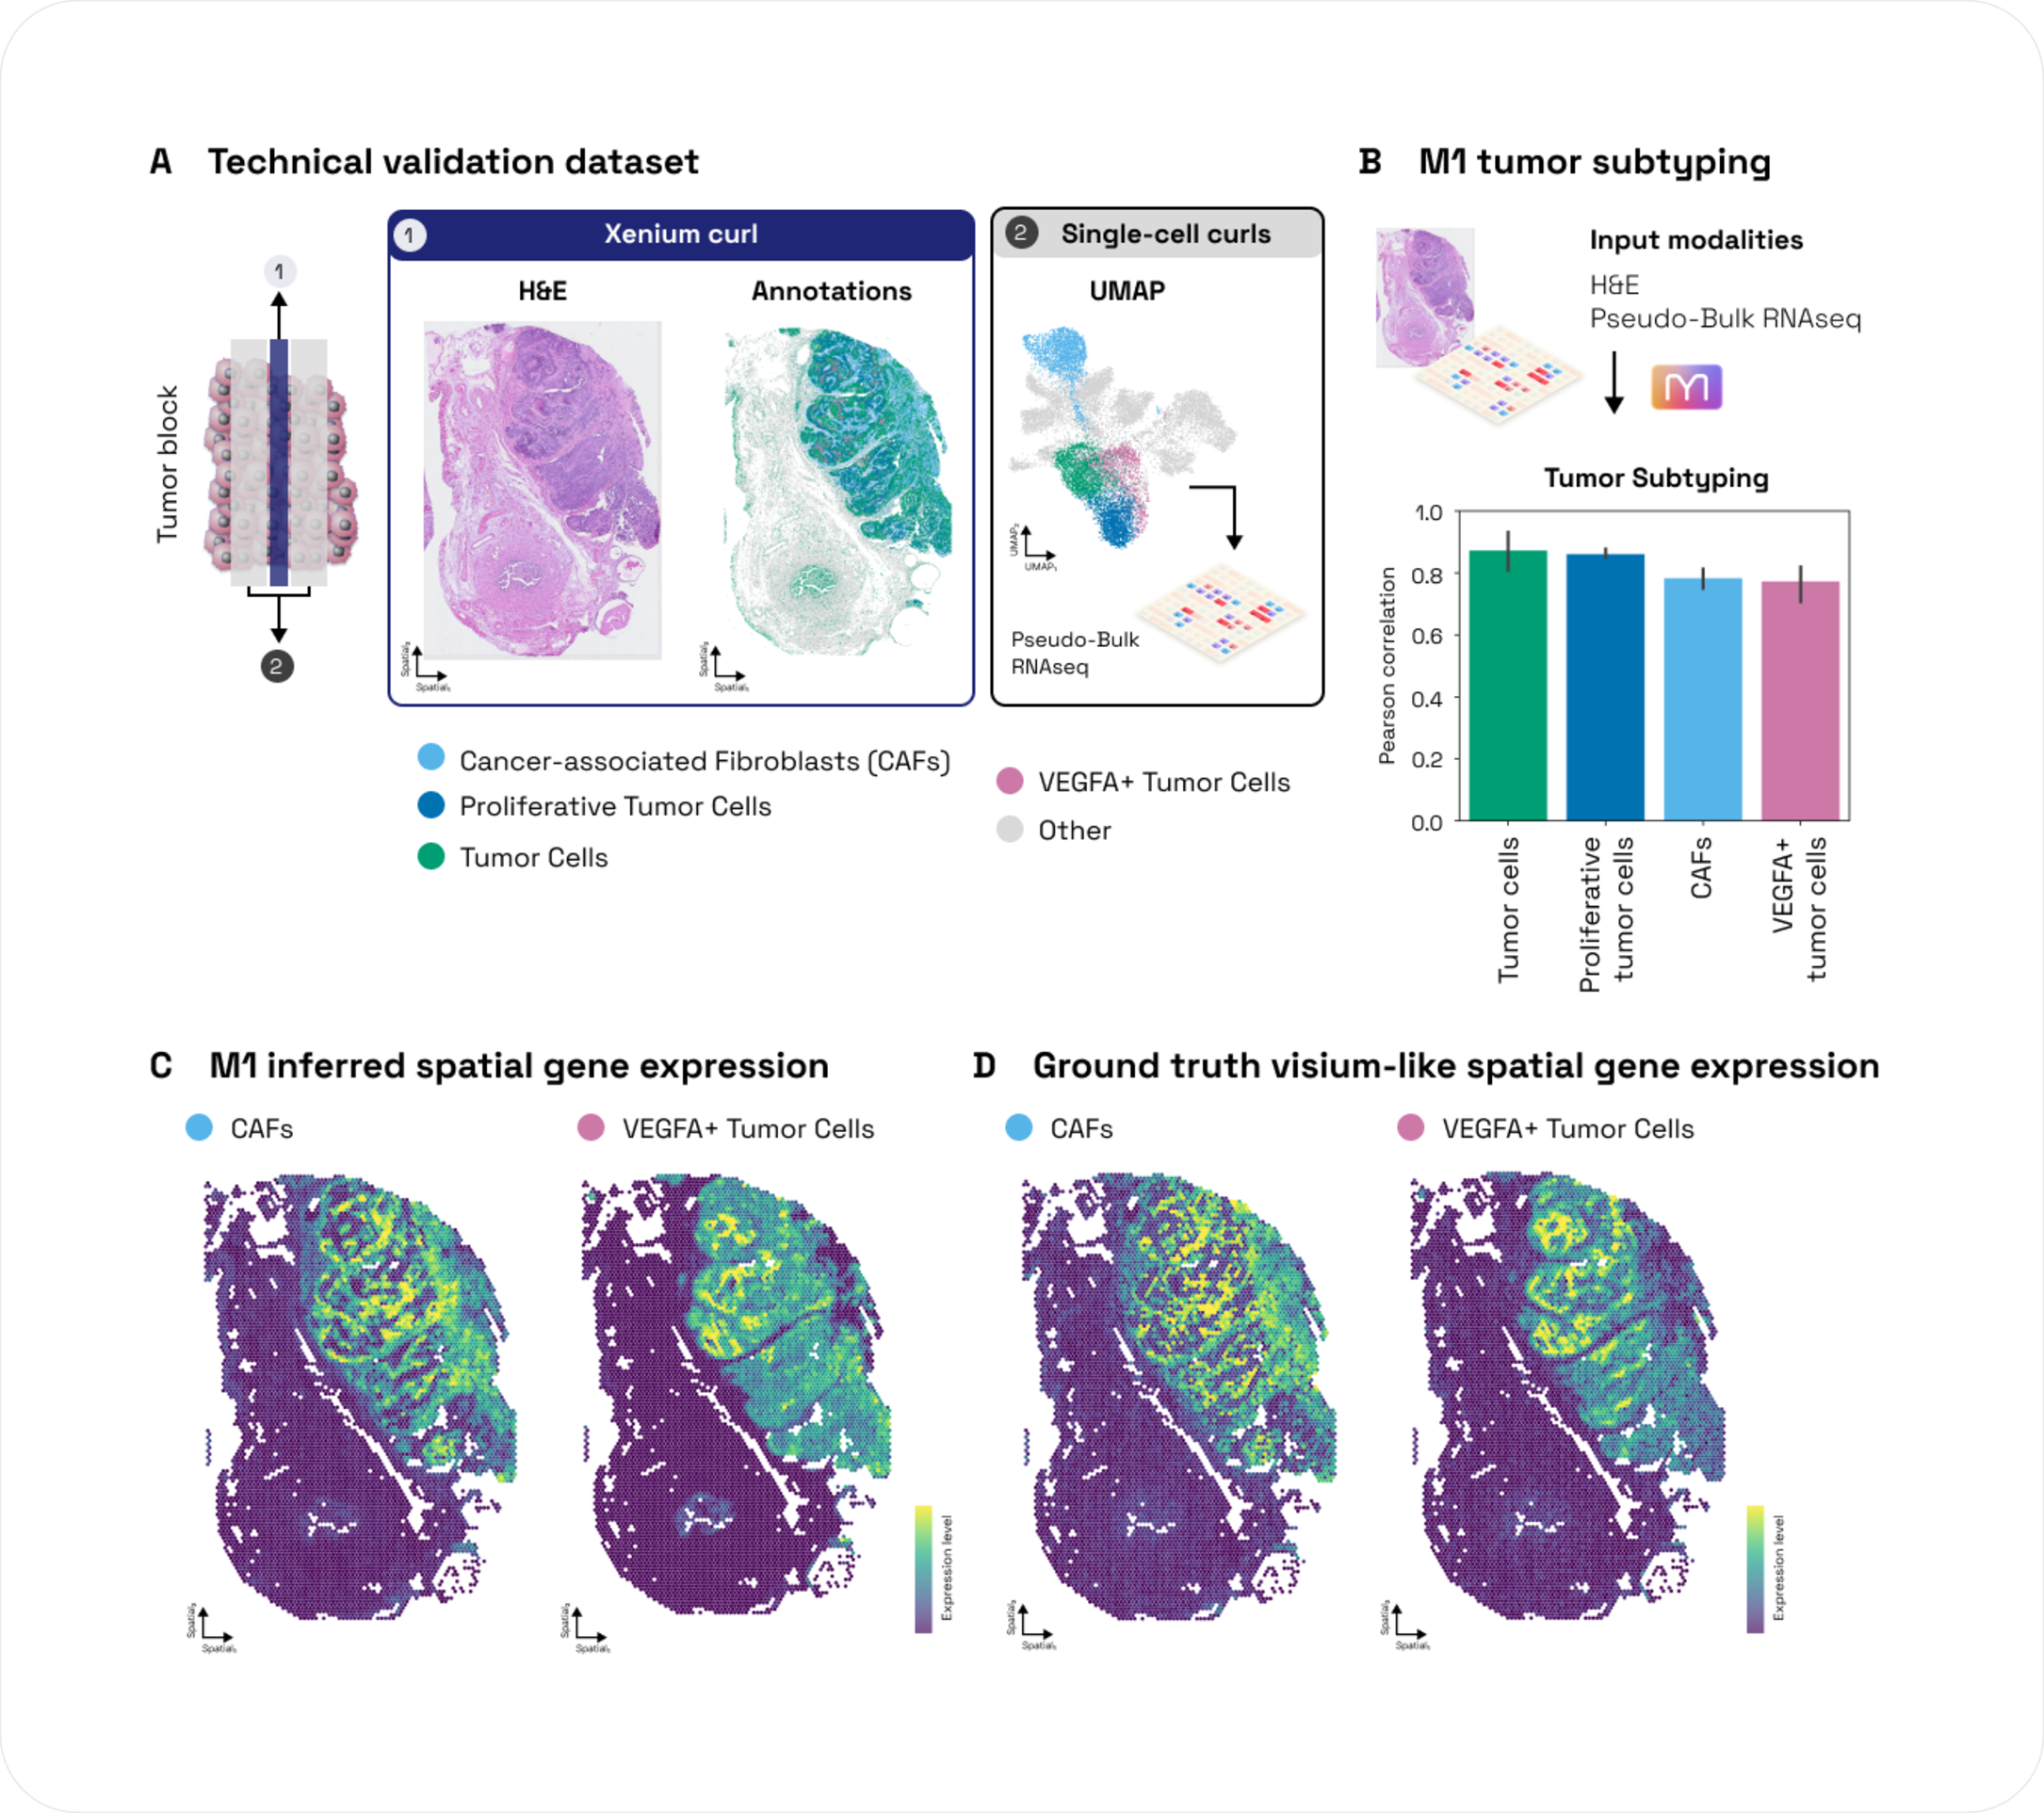
Figure 2: M-Optimus-1 correctly infers spatial variations on an unseen ovarian cancer slide. (A) Technical validation dataset measuring an ovarian cancer sample with 10x Genomics Xenium Prime and single-cell FFPE Flex aggregated to pseudo-bulk resolution. Displayed are the H&E, the spatial allocation of annotated cells within the Xenium slide as well as a UMAP computed on the single-cell data colored by cell types relevant in ovarian cancer. (B) Mean Pearson correlation coefficient (PCC) across all individual genes linked to the respective subtype. Error bars indicate the bootstrapped confidence interval. Mean PCC over all four subtypes displayed r=0.81. (C-D) M-Optimus-1 predicted (C) and ground truth (D) spatially resolved expression profiles for CAF and VEGFA+ tumor cells as predicted by M-Optimus-1 in multimodal-inference mode. Shown are the log1p-transformed aggregated gene signatures for each cell type of interest.
The subtypes we are discussing in detail in this blog post are cancer-associated fibroblasts (CAFs), the builders, protectors, and feeders of the tumor, and VEGFA+ tumor cells, the “environmental architects” (see Deep dive: tumor subtyping in ovarian cancer). Those two subpopulations are commonly found in ovarian cancers and can significantly guide which treatment regime to choose for a patient. And more importantly, their combination is what matters for the optimal treatment regime and recent research focuses on their impact on ovarian cancer survival and therapy9-11. For those two subtypes M-Optimus-1 achieved a mean Pearson correlation of r = 0.78 indicating that in ovarian cancer M-Optimus-1 accurately reconstructs the spatial patterns introduced by both VEGFA+ tumor cells and CAFs.
Deep Dive: tumor subtyping in ovarian cancer
We subtype in this blog post for the following cell states present in a tile or niche: a general tumor niche, cancer-associated fibroblasts, proliferative tumor cells, and VEGFA+ tumor cells. Those cell types significantly modulate the TME and can show strong interactions with other cell types relevant for ovarian cancer. Hence, the deep dives below discuss and highlight additional subtypes whenever relevant.
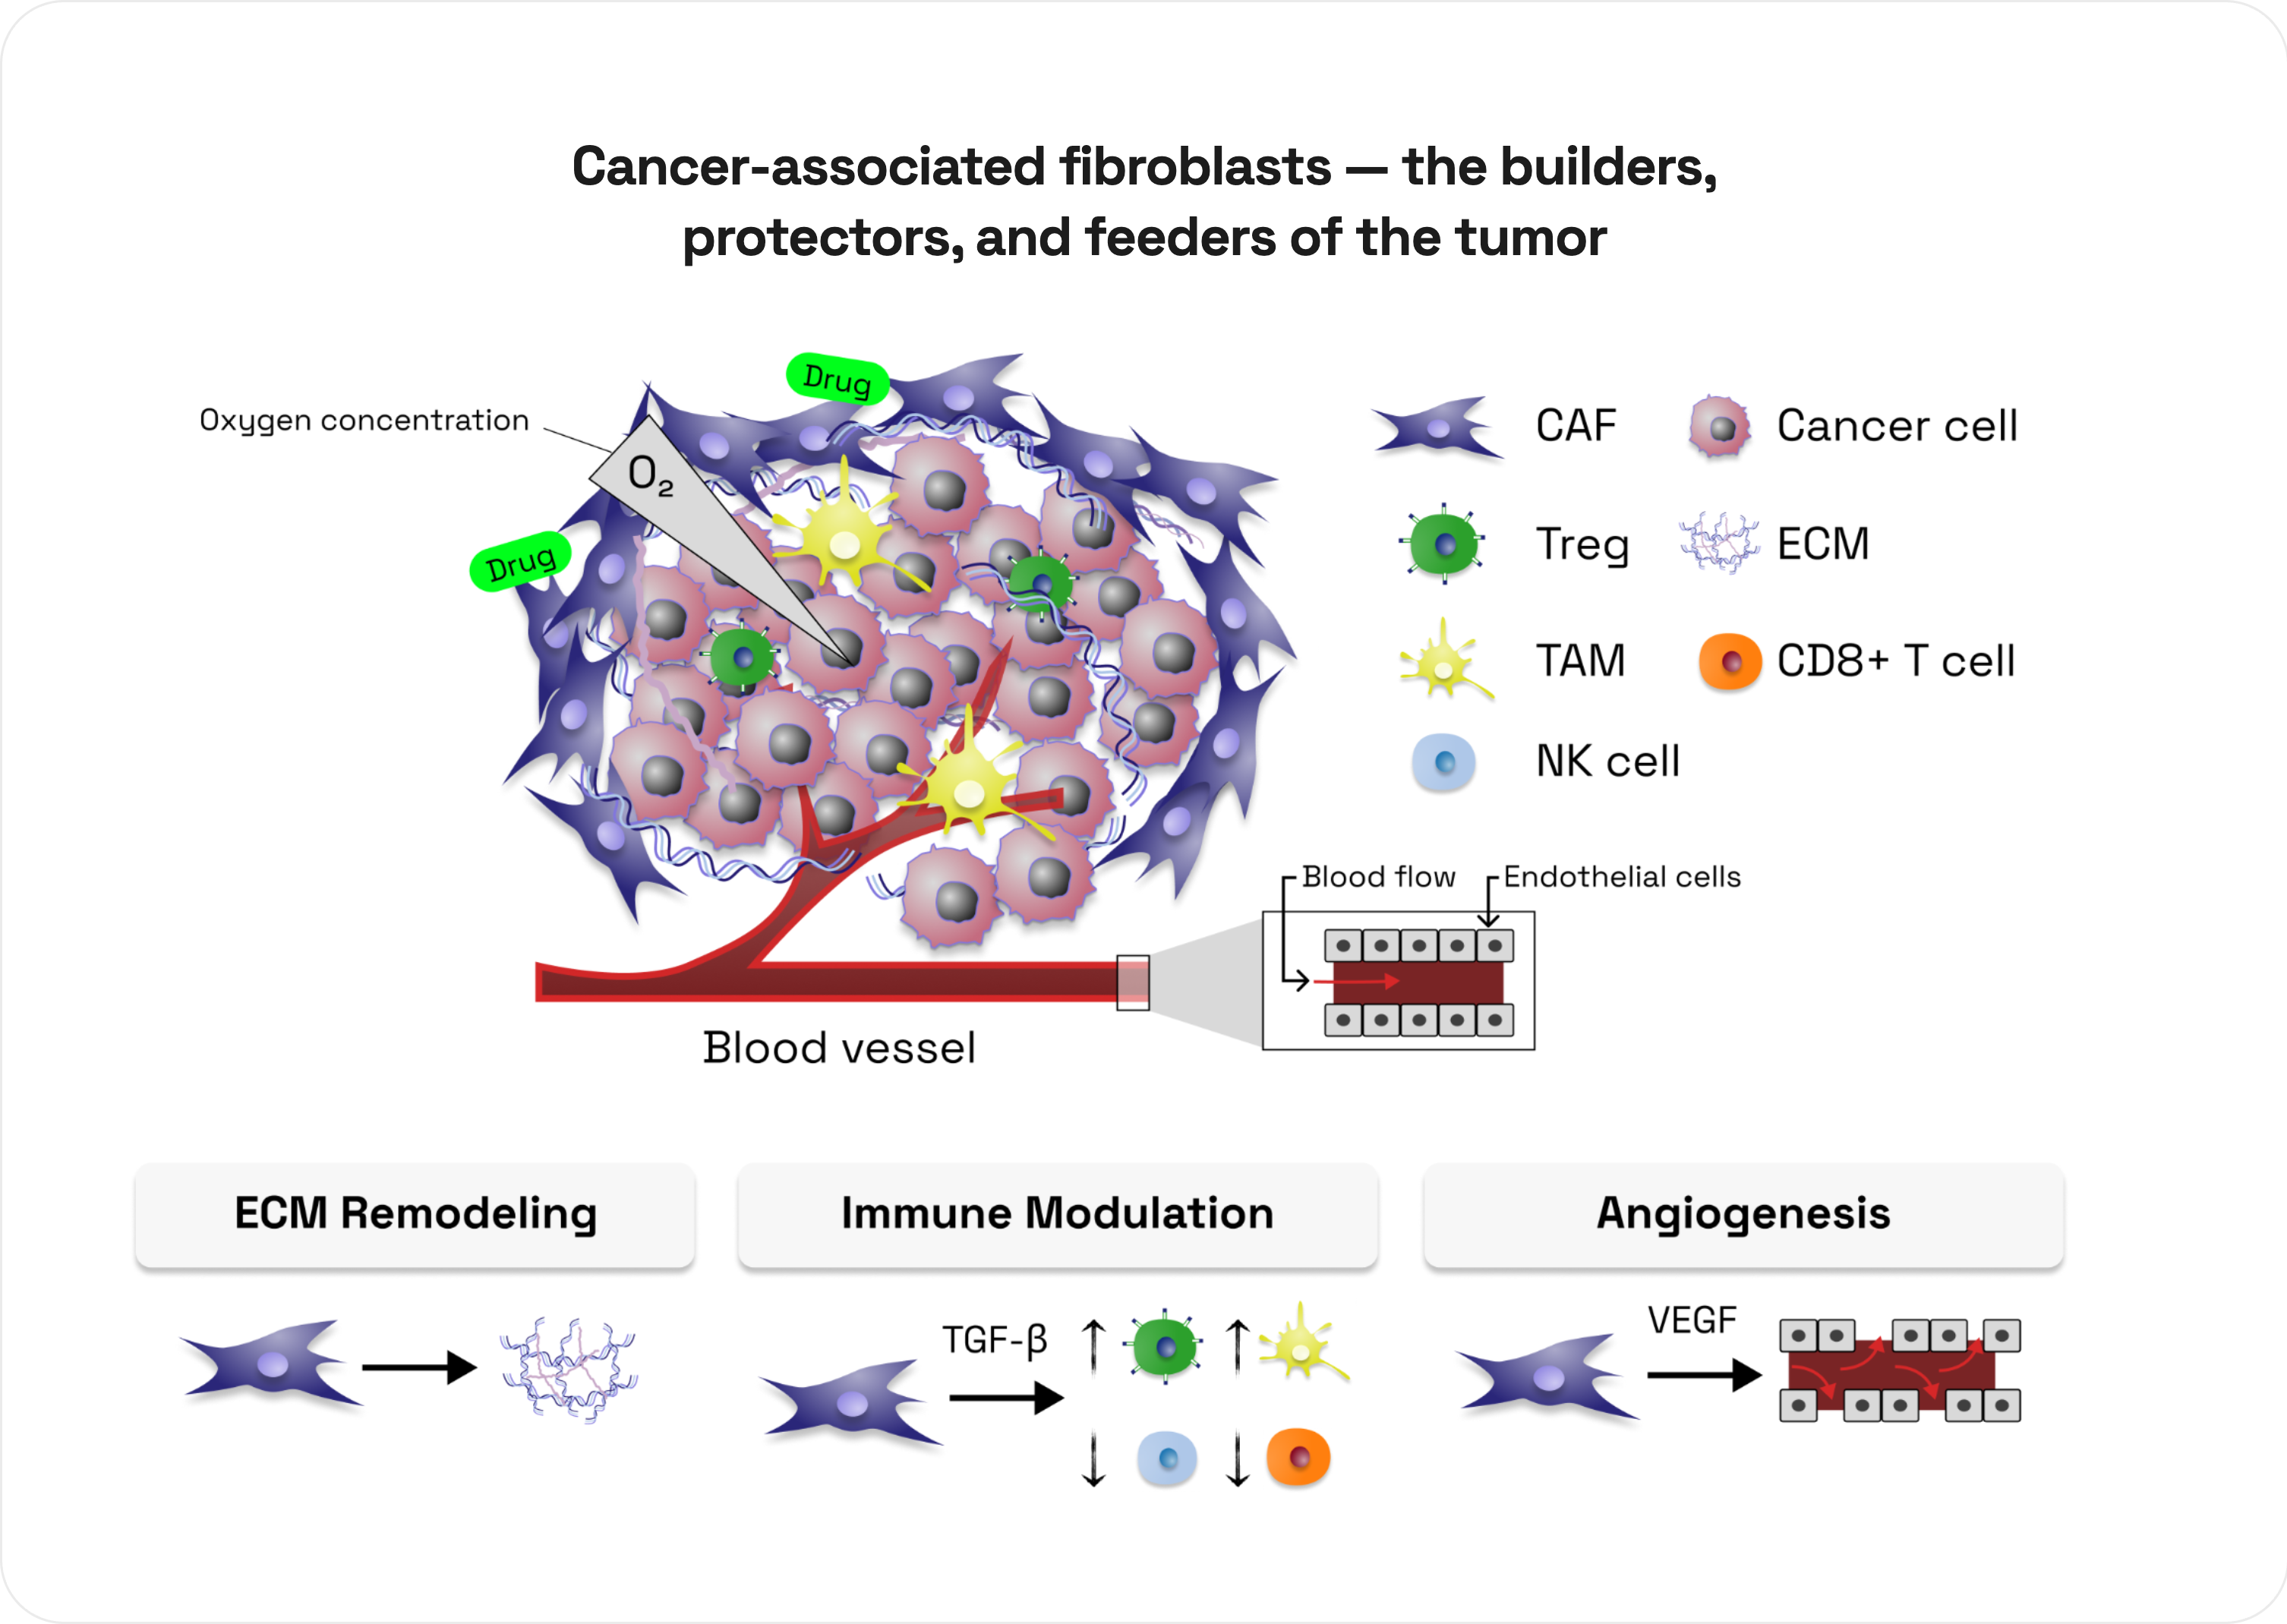
Deep dive figure: Role of cancer-associated fibroblasts (CAFs) in the tumor microenvironment. Schematic illustrating CAF-driven stromal alterations, including extracellular matrix (ECM) remodeling, TGF-β mediated immune suppression (increasing Tregs/TAMs and decreasing NK/CD8+ T cells), and VEGF-induced angiogenesis within the hypoxic and drug-restricted tumor microenvironment.
In ovarian cancer, CAFs act essentially as "corrupted" structural cells that build, protect, and feed the tumor. While normal fibroblasts maintain the structural integrity of healthy tissues, CAFs are hijacked by cancer cells. They become the dominant cellular component of the tumor microenvironment (the surrounding cellular ecosystem), actively driving the progression of the disease.
One crucial aspect of CAFs in the TME is their ability to create an immune-suppressive shield. CAFs actively prevent the patient's immune system from fighting back. They secrete immunosuppressive factors that effectively neutralize or re-program surrounding immune cells:
- They suppress Cytotoxic T cells and Natural Killer cells, rendering them unable to attack the tumor.
- They recruit Regulatory T cells (Tregs) and Myeloid-Derived Suppressor Cells (MDSCs), which actively protect the tumor from being recognized by the immune system.
Understanding CAFs has shifted modern oncology away from treating only the cancer cell itself. Current clinical trials are actively exploring ways to either deplete CAFs entirely, reprogram them back into normal fibroblasts, or block the specific chemical signals that they use to support the tumor.
Proliferating tumor cells
Proliferating tumor cells in ovarian cancer drive rapid disease progression and metastasis. This relentless growth is fueled by dysregulated signaling pathways and a supportive microenvironment. These fast-dividing cells are the primary target of chemotherapy, though they often adapt, mutate, and develop treatment resistance.
VEGFA+ tumor cells - the environmental architects
While VEGFA is traditionally studied as a signaling molecule that stimulates blood vessel growth, identifying a cluster of tumor cells as specifically VEGFA+ carries heavy implications for how the tumor behaves, remodels its local neighborhood, and resists advanced therapies like ADCs12. Ovarian tumors grow so rapidly that they frequently outstrip their oxygen supply, creating pockets of profound hypoxia. When tumor cells starve for oxygen, a transcription factor called HIF-1alpha turns on. HIF-1alpha directly triggers the massive transcription of VEGFA. Therefore, seeing a dense cluster of VEGFA+ tumor cells on a spatial transcriptomics map acts as a molecular flare gun, pointing directly to the most hypoxic, metabolically stressed, and aggressive zones of the tumor.
But there is even more to VEGFA. VEGFA secreted by these tumor cells does not just talk to blood vessels; it acts as a potent immune-modulating hormone that actively shuts down the local immune system. It recruits the aforementioned life-support system of the tumor composed of MDSCs, Tregs, and tumor-associated macrophages (TAMs) into the tumor niche. All of those protect the tumor and make it close to impossible for the ADC to fully function.
And last but not least, VEGFA+ tumor cells can lead to a loss of bystander efficacy. Many modern ovarian cancer ADCs rely on the "bystander effect", where the cleaved drug leaks out to kill surrounding cells, triggering immunogenic cell death. The heavy shield of MDSCs and TAMs recruited by VEGFA cells completely neutralizes this secondary immune-mediated wave of destruction.
Because VEGFA+ tumor cells are so effective at defending themselves, they are the primary reason why clinical trials in ovarian cancer heavily favor combining ADCs with anti-angiogenic therapies like bevacizumab. Inhibiting the VEGFA pathway "normalizes" the chaotic blood vessels, drops the interstitial pressure, and opens the door for the ADC to successfully penetrate and deliver its payload.
M-Optimus-1 enriches pathologist annotations with cell type specific molecular subtypes
In oncology, precise pathologist annotations and cellular microenvironments (niches) are fundamental to clinical decision-making because they capture coarse grained spatial structures and heterogeneity of a tumor. Traditional pathologist annotations obtained from standard Hematoxylin and Eosin (H&E) stained slides remain the bedrock of clinical oncology. For treatment selection, these morphological annotations provide immediate, actionable insights. For example, tumor-infiltrating lymphocytes detected in the H&E can guide whether a patient should receive immunotherapy13.
Spatially resolved genomics effectively define spatially dependent microenvironments informed by molecular signatures such as immune or tumor niches. Notably, those niches have been shown to be associated with clinical outcomes and serve as potential spatial biomarkers to better predict response to treatment and overall and progression-free survival14.
While to a certain degree, niches of the TME can be identified from H&E alone, they lack the molecular granularity needed for subtyping (Fig.3 A-B). The latter cannot be observed in a standard H&E alone but requires spatially resolved molecular data like spatial transcriptomics. More importantly, since the TME can be quite heterogeneous, one might require multiple tissue sections per patient to enable a comprehensive characterization of the complex molecular structures15. Generating serial sections with H&E alone and enriching them with pathologist annotations is relatively affordable and would translate to a few hundred to a few thousand dollars if the tumor block is large. Measuring the same tumor block with spatial transcriptomics to obtain a 3D TME-map is close to 100-fold more expensive. Additionally, due to the limited capture area you would not even have access to the entire molecular diversity the tumor comprises. Using M-Optimus-1 does not lead to this cost explosion, is scalable and not prone to experimental limitations and artefacts.
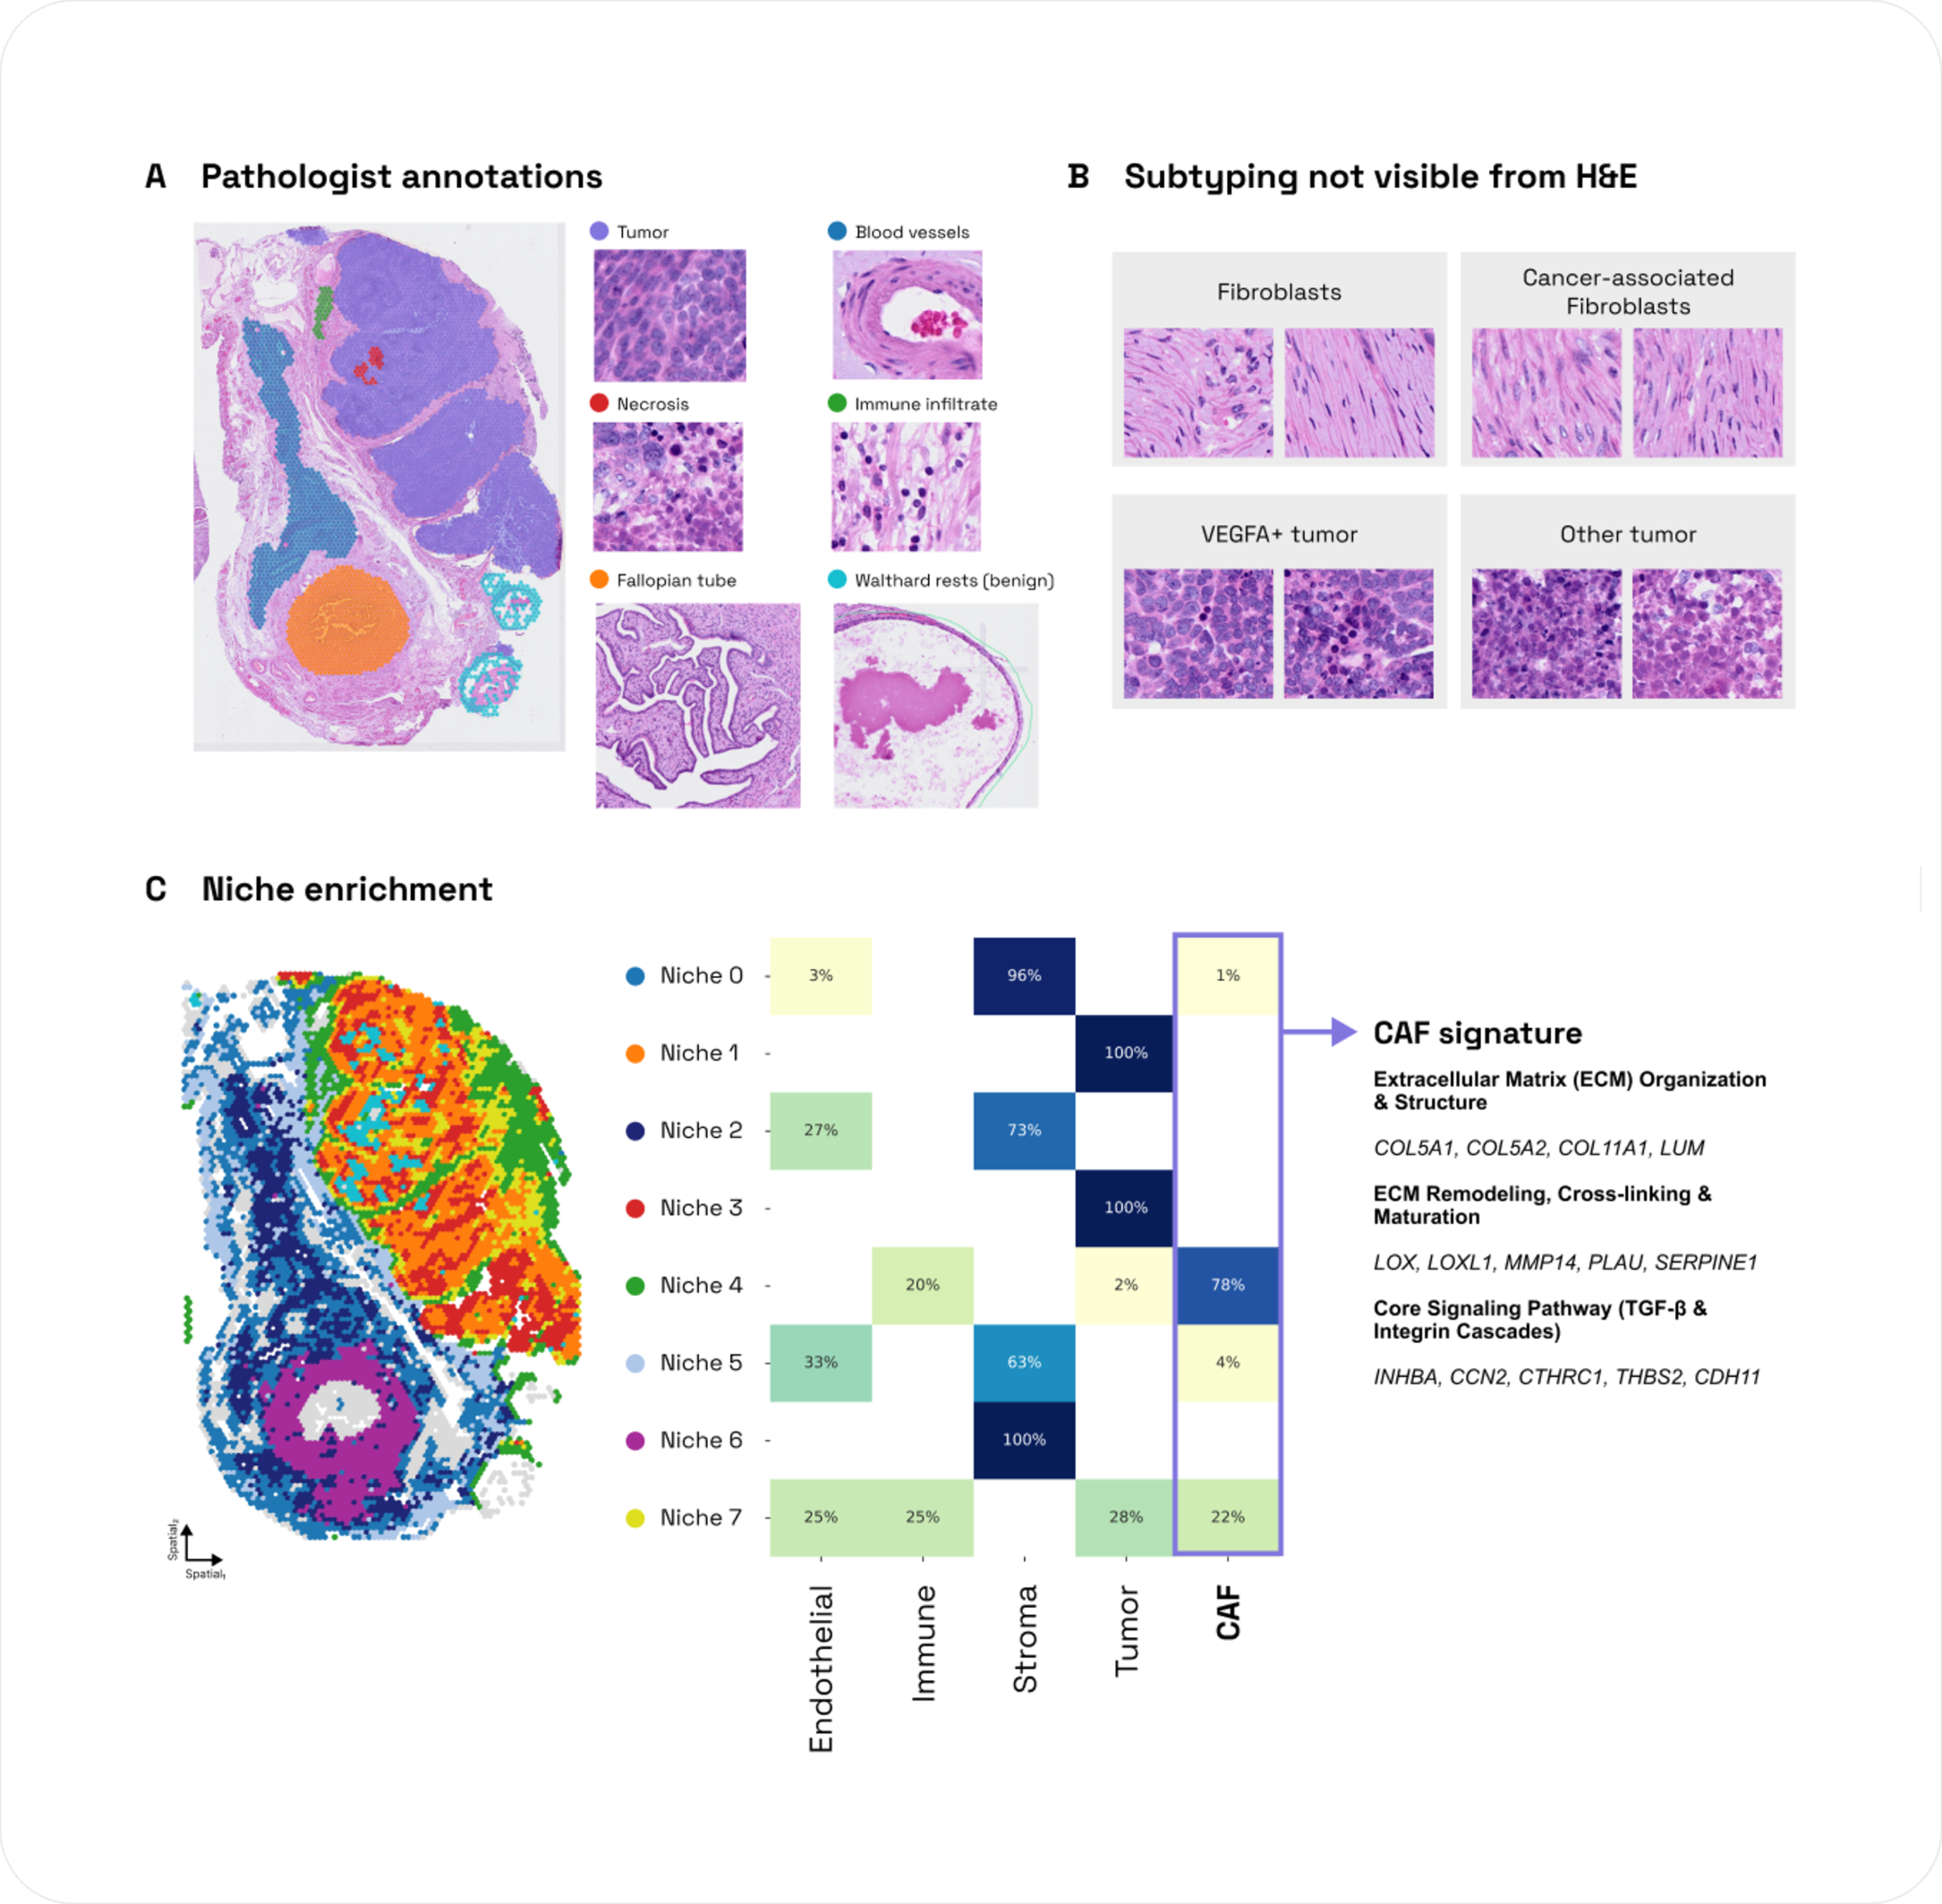
Figure 3: M-Optimus-1 enables identification of molecularly defined niches. (A) Histopathology alone can provide coarse grained labels to differentiate between different functional units of biology. Shown are exemplary tiles for the six regions annotated by a pathologist. The regions for blood vessel, tumour, immune infiltrate and necrosis depict a region of 87 x 100 μm2.(B) The molecular tumor heterogeneity is not observable from H&E alone. Shown are exemplary tiles from the tumor-annotated region for fibroblasts, cancer-associated fibroblasts, general tumor tiles and tumor tiles enriched for VEGFA. (C) Spatial allocations of niche annotations derived with M-Optimus-1-inferred spatial gene expression profiles. Derived cell-type specific enrichments per niche indicating the cell-type composition present in each niche. We only show niche compositions with significant enrichments (p-value <= 0.05). The cancer-associated fibroblast (CAF) signature appended to the enrichment comprises genes linked to the extracellular matrix (ECM) organization and structure, the ECM remodeling, cross-linking and maturation, as well as the cross signaling pathway. Niches with non significant differentially expressed genes or enriched gene sets are removed from the heatmap.
M-Optimus 1 can unlock this additional layer of information at scale. To assess whether the M-Optimus-1-inferred molecular signatures can be leveraged to enrich pathologist annotations, we developed an unsupervised niche-annotation framework which takes the M-Optimus-1-inferred 6,000 genes as input. We applied this niche annotation framework to the M-Optimus-1-inferred expression profiles obtained from H&E alone to allow for a more fair comparison to standard pathologist workflows which typically do not account for bulk-RNA seq expression profiles. We then evaluated whether the M-Optimus-1 signatures maintain biologically coherent spatial structures also detected by a trained pathologist. The analysis recovered discrete niches with distinct cell-type compositions.
With this framework, hypothesis testing and spatial discovery can be performed at scale for genes well predicted by M-Optimus-1. Therefore, understanding spatial dependencies is no longer limited to only a few genes. For the ovarian cancer slide, we appended a distinct cellular subtype to our previous niche and enrichment analysis. CAFs are currently discussed to contribute to ovarian cancer progression and treatment failure. More information on why CAFs are relevant in the context of ovarian cancer can be found in the Deep dive: tumor subtyping in ovarian cancer. We observe a strong enrichment for CAFs in niche 4 spatially close to the core tumor area. This enrichment indicates that the tumor has built a life support through fostering an immunosuppressive and pro-tumorigenic niche. Further, distinct CAF subtypes are significantly associated with patient prognosis and response to immunotherapy16.
To validate our framework we compared M-Optimus-1-derived niche enrichments against cell-type compositions measured on the same tissue by 10x Genomics Xenium Prime. Predicted per-niche enrichment fractions correlated strongly with the measured compositions (Pearson r = 0.899). This result indicates that the M-Optimus-1-inferred gene expression profiles indeed accurately reflect cellular biology present in each niche.
M-Optimus-1 derived in silico spatial gene expression profiles provide a search space for spatial biomarkers linked to treatment
Archival H&E slides and historical datasets paired with clinical data represent an ideal resource for high-throughput spatial biomarker discovery. Deploying M-Optimus-1 to infer SpT directly from H&E whole slide images enables the scalable reconstruction of molecular topographies across vast historical cohorts without the prohibitive cost, technical variability, or tissue destruction required by wet-lab spatial sequencing. M-Optimus-1’s image-to-transcriptome paradigm transforms routine histology into high-dimensional spatial gene expression maps, which allows for the systematic search of spatial biomarkers.
We tested the M-Optimus-1-scaled spatial biomarker discovery pipeline on a public Ovarian Bevacizumab Response cohort17. This cohort allows us to showcase how M-Optimus-1 can be used in practice for the enrichment of historical cohorts. However, as this dataset was acquired as a retrospective study, metadata and data quality in general is a large confounder. We therefore only apply a limited and targeted spatial biomarker discovery pipeline to test biologically plausible hypotheses and show how we envision the application of M-Optimus-1 on similar cohorts.
Deep Dive: Ovarian Bevacizumab Response Dataset
This dataset17 is a retrospective study of patients diagnosed with ovarian cancer. Samples were collected through the tissue bank of the Tri-Service General Hospital and the National Defense Medical Center, Taipei, Taiwan. The complete cohort comprises a total of 288 H&E whole slide images with clinical information from a total of 78 patients.
In this dataset, the CA-125 concentration is used as an indication whether the slide of a patient is classified as the bevacizumab-resistant group (invalid) or the bevacizumab sensitive group (effective).
In this dataset, the CA-125 concentration is used as an indication whether the slide of a patient is classified as the bevacizumab-resistant group (invalid) or the bevacizumab sensitive group (effective).
While this dataset provides a perfect theoretical example of how to apply M-Optimus-1 to retrospective cohorts, it does not provide the controlled set-up needed to understand which patients would benefit from antiangiogenic agents. The dataset, for example, contains both patients which received bevacizumab as front line, second line and maintenance therapy and time lines of H&E acquisitions are unclear. Hence, treatment effectiveness could also be linked to the intraperitoneal chemotherapy. Reducing patients to only one of the aforementioned three categories would reduce sample size below a threshold required for sufficient statistical power. Hence, we only showcase an exemplary usage of the molecular gene expression profiles inferred by M-Optimus-1 but do not draw conclusions on the actual treatment effectiveness of bevacizumab in those patients.
We leveraged M-Optimus-1 in H&E-only mode and inferred the gene expression profile across a gene set of 6,000 genes for each slide in the cohort. Spatial colocalization of cell types of interest is one plausible candidate for spatial biomarker discovery as it describes relevant properties of the TME. We specifically tested whether the spatial correlation across all tiles and slides of VEGFA+ tumor co-localized with the other subtypes, discussed above and shown in Fig. 4, show significant differences between slides classified as effective versus invalid. Indeed, the M-Optimus-1 spatial signature of VEGFA+ cells coexpressed with CAFs was higher in slides labeled as invalid (Fig. 4B) as assessed via a one-sided Wilcoxon-Mann-Whitney test (p-value=0.003). Our workflow showcases that the spatial context matters for understanding the TME and spatial biomarkers are promising avenues for cohorts which are not yet fully understood.
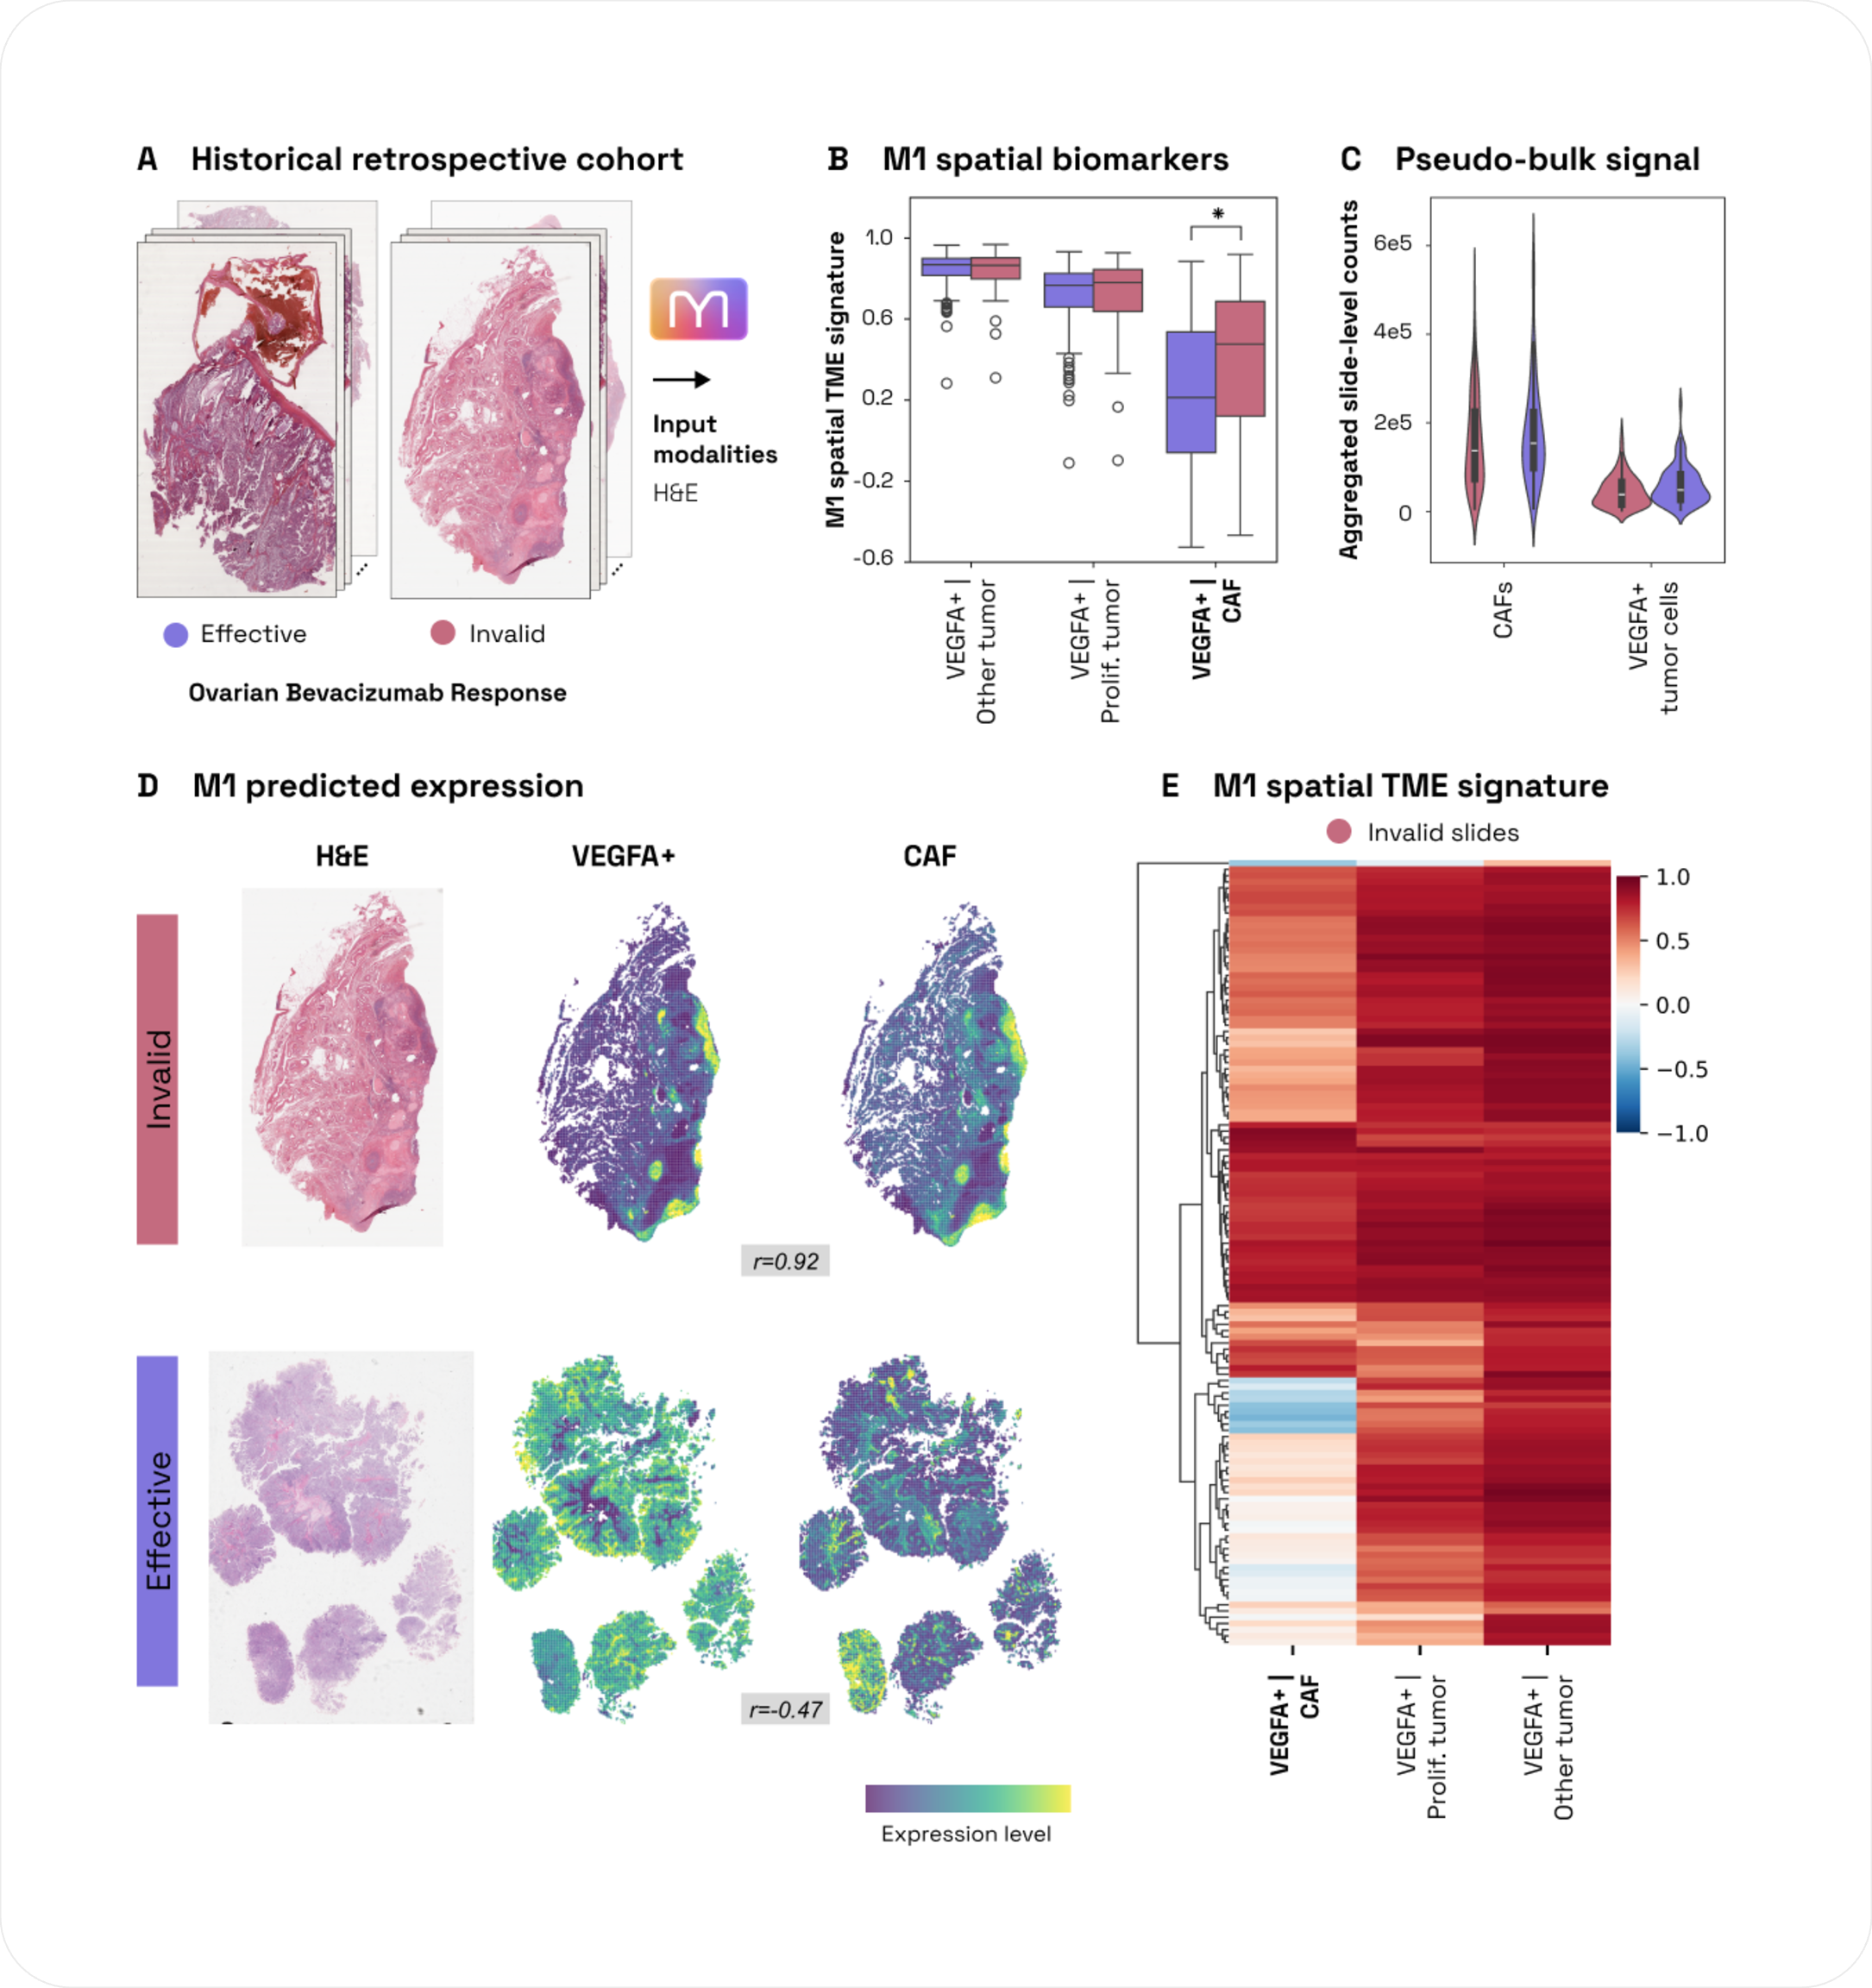
Figure 4: M-Optimus-1 derived in silico spatial gene expression profiles provide a search space for spatial biomarkers. (A) Exemplary H&E slides of the ovarian bevacizumab response dataset for responders and non-responders. (B) Boxplot of colocalization of respective cell types grouped by treatment response status. Center lines denote medians; box limits indicate the 25th and 75th percentiles; whiskers extend 1.5 times the interquartile range from the 25th and 75th percentiles (154 slides effective, 128 slides invalid). The * denotes a p-value < 0.05 when comparing the two treatment response groups (one-sided Mann–Whitney U test). (C) Distribution of pseudo-bulked patient-level expression profiles of CAF and VEGFA+ tumor cells as inferred by M-Optimus-1. Violin plots display the kernel density estimation of data distributions; center lines denote medians, and internal dashed lines indicate the 25th and 75th percentiles (154 slides effective, 128 slides invalid). (D) Exemplary H&E slides and M-Optimus-1-inferred spatial gene expression profiles for a non-responder and responder patient respectively. Shown are the patients with the strongest VEGFA+ and CAF M-Optimus-1 spatial signature in the non-responder group (top; patient identifier 1733608; slide identifier 1625960J; r=0.91) and lowest M-Optimus-1 spatial signature in the responder group (bottom; patient identifier 2004960; slide identifier 1920532A-Y; r=-0.47). (E) Hierarchical clustering heatmap of z-score normalized cell type co-localizations across all slides labeled as effective. Row and column are sorted through hierarchical clustering derived using Euclidean distance with average linkage.
Next, we focused on the slides labeled as invalid and had a measurable regrowth of the tumor. We observe major differences in the predicted spatial co-expression patterns across the slides in this cohort (Fig. 4E). For example, some patients show a strong co-localization of VEGFA+ tumor cells with CAFs, while others seem to exhibit different TME signatures. Based on this stratification, one could now design targeted treatment regimes designed to tackle and suppress the distinct tumor promoting subtypes present in those patients. For example, recent clinical trials (e.g. PAOLA-1 trial) have explored olaparib, a PARP inhibitor, plus bevacizumab as first-line maintenance treatment for ovarian cancer especially for patients with BRCA mutations18. However, PARP inhibitors have also shown to promote CAFs in the TME which highlights the need for new dual- or multi-targeting strategies specifically designed to target a patient's distinct TME19. With M-Optimus-1, modern treatment regimes can be designed by accounting for a patient's distinct spatial molecular profile at scale, paving the way for personalized medicine.
This is only the beginning:
TME features unlocked at scale with M-Optimus-1 and brought to your use-case
M-Optimus is available now. If you are working on drug discovery, clinical trial enrichment, biomarker discovery, or retrospective analysis of patient cohorts and you’d like to explore what the model can do on your data, contact us.

References
1. The Cancer Genome Atlas Research Network et al. The Cancer Genome Atlas Pan-Cancer analysis project. Nat. Genet. 45, 1113–1120 (2013).
2. Zhang, M., Lu, Y. & Yuan, X. The tumor microenvironment: a dynamic ecosystem and therapeutic nexus in modern oncology. Front. Pharmacol. 17, 1836055 (2026).
3. AACR. September is Ovarian Cancer Awareness Month. (https://www.aacr.org/patients-caregivers/awareness-months/ovarian-cancer-awareness-month/).
4. 10x Genomics. FFPE Human Ovarian Cancer with 5K Human Pan Tissue and Pathways Panel plus 100 Custom Genes. (2024).
5. Mei, L. et al. Maintenance chemotherapy for ovarian cancer. Cochrane Database Syst. Rev. 2022, (2013).
6. Pujade-Lauraine, E. et al. Bevacizumab Combined With Chemotherapy for Platinum-Resistant Recurrent Ovarian Cancer: The AURELIA Open-Label Randomized Phase III Trial. Obstet. Gynecol. Surv. 69, 402–404 (2014).
7. Monk, B. J. et al. Patient reported outcomes of a randomized, placebo-controlled trial of bevacizumab in the front-line treatment of ovarian cancer: A Gynecologic Oncology Group Study. Gynecol. Oncol. 128, 573–578 (2013).
8. “Significant Activity” for ADC in Ovarian Cancer. Cancer Discov. 11, OF3–OF3 (2021).
9. Garlisi, B. et al. The Complex Tumor Microenvironment in Ovarian Cancer: Therapeutic Challenges and Opportunities. Curr. Oncol. 31, 3826–3844 (2024).
10. McQuarter, A. A. et al. The Role of Cancer-Associated Fibroblasts and Tumor-Associated Macrophages in the Tumor Microenvironment and Their Impact on Ovarian Cancer Survival and Therapy. Curr. Oncol. 33, 59 (2026).
11. Hwang, S.-Y., Lee, D., Lee, Y.-G., Ahn, J. & Kang, Y.-J. Cancer-metastasis-on-a-chip reveals efficacy of bevacizumab and siRNA in overcoming carboplatin resistance in SKOV3 ovarian cancer within a fibrotic metastatic microenvironment. Mater. Today Bio 34, 102240 (2025).
12. Zhao, Y. et al. Vascular endothelial generating factor pathway in ovarian cancer. J. Ovarian Res. 18, 272 (2025).
13. Kraja, F. P. et al. Tumor-infiltrating lymphocytes in cancer immunotherapy: from chemotactic recruitment to translational modeling. Front. Immunol. 16, 1601773 (2025).
14. Li, J. et al. Pan-cancer analysis of spatial transcriptomics reveals heterogeneous tumor spatial microenvironment. Cell Rep. Med. 7, 102751 (2026).
15. Li, W. et al. Characterizing intra- and inter-tumor heterogeneity in Ovarian high-grade serous carcinoma subtypes using single-cell and spatial transcriptomics. Preprint at https://doi.org/10.1101/2025.09.15.676244 (2025).
16. Zhang, C. et al. CAFs orchestrates tumor immune microenvironment—A new target in cancer therapy? Front. Pharmacol. 14, 1113378 (2023).
17. Wang, C.-W. et al. A dataset of histopathological whole slide images for classification of Treatment effectiveness to ovarian cancer (Ovarian Bevacizumab Response). The Cancer Imaging Archive https://doi.org/10.7937/TCIA.985G-EY35 (2021).
18. Ray-Coquard, I. et al. Olaparib plus Bevacizumab as First-Line Maintenance in Ovarian Cancer. N. Engl. J. Med. 381, 2416–2428 (2019).
19. Fang, T. et al. PARP inhibitors accumulate B7-H3 on fibroblasts via blocking autophagic flux to potentiate immune evasion in ovarian cancer. OncoImmunology 14, 2516294 (2025).