Blog - May 20, 2026

From Fragments to Maps: M-Optimus Decodes the Molecular Geography of Cancer

Bioptimus is building a world model for biology: models that learn across biological modalities simultaneously, the way biology actually operates inside the body. M-Optimus-1 is our first iteration towards that goal. This post describes what we built, what we found, and the impact we could envision for drug discovery, diagnostics, and the patients of the future.

TL;DR:

minimize
For decades, medicine has viewed the human body in fragments. We study DNA in one room, analyze organ scans in another, and file blood tests in a third. Because these silos don't talk to each other, we often miss the complex, interconnected reality of human health.
Bioptimus is changing that. We are building the connective tissue of modern biology, reintegrating these isolated fragments into one holistic picture. By reuniting these different layers of data, we are creating a "Digital Twin" of the human body: a world model capable of simulating how a disease progresses or a drug works before it ever reaches a patient.
The Milestone: Introducing M-Optimus-1. Our first major step toward this vision is M-Optimus-1 (M1). M1 is a first-of-its-kind model that simultaneously reads and reunifies three vital biological layers: the physical structure of tissues, the heterogeneity of cells within tissues, and the molecular activity happening inside cells. By learning these languages at the same time from multimodal data (biopsy images and spatial transcriptomics), M1 sees the connections that traditional methods miss.
The Results: Why Multimodal AI Wins. Our findings confirm that when AI stops looking at fragments and starts looking at the whole, the results are transformative:
  1. 60% More Accurate: By looking at multiple biological languages at once, M1 delivers up to 60% better performance than well-established competing models.
  2. The Power of One General Model: We proved that one generalist brain is more powerful and versatile than many small, specialized models.
  3. Unlimited Growth: M1 gets smarter as it sees more data. Through our STELA program—an ambitious effort to build a global biological database—we are fueling M1 with the data it needs to master human biology.
Why It Matters: Turning Routine Data into Deep Insight. The most exciting part? M1 can uncover deep genetic insights (across 20,000 genes) using only routine, low-cost tissue slides that already exist in every hospital. This turns a routine histology slide into a high-powered diagnostic tool, unlocking:
  1. Mining the Past: Analyzing decades of historical clinical trials at a fraction of the original cost to find out why certain drugs worked for some but not for others.
  2. Better Target Discovery: Finding needles in haystack biomarkers to help get the right drugs to the right patients faster.
  3. Seeing the Invisible: Characterizing tumors with a level of detail that is literally invisible to the human eye, even under a microscope.
M1 is just the beginning. At Bioptimus, we are revealing the unseen biology that will define the next generation of medicine.

Biology has always been studied in fragments

The human body is a single, integrated biological system. Inside us, a cell’s behavior is the combined output of its DNA, the genes it expresses, the signals it receives from other cells and molecules, the proteins it builds, and the complex environment of the tissue surrounding it.
Yet, for decades, our tools have forced us to look at this system through a fragmented lens. We use genomics to look at DNA, pathology to look at images, and clinical tests to look at biofluids. Each tool provides a vital view, but it is only one view. Because these layers haven't talked to each other, we have missed the deeper, interconnected reality of human health.
This fragmentation has persisted due to two fundamental hurdles:
  1. Complexity: Biology is so intricate that traditional computational tools simply couldn't process these layers holistically.
  2. Scarcity: Truly cross-modal data, where every layer is measured for the same patient at the same time, has been extraordinarily rare.
Today, we have reached a turning point. The surge in AI processing power and new model architectures finally allow us to capture a multimodal picture of biology. Simultaneously, new high-definition technologies (like spatial transcriptomics) are giving us the richest biological data in history. At Bioptimus, we are seizing this moment to build a world model for biology: a single intelligence that reads across scales and modalities to answer questions that current science cannot.

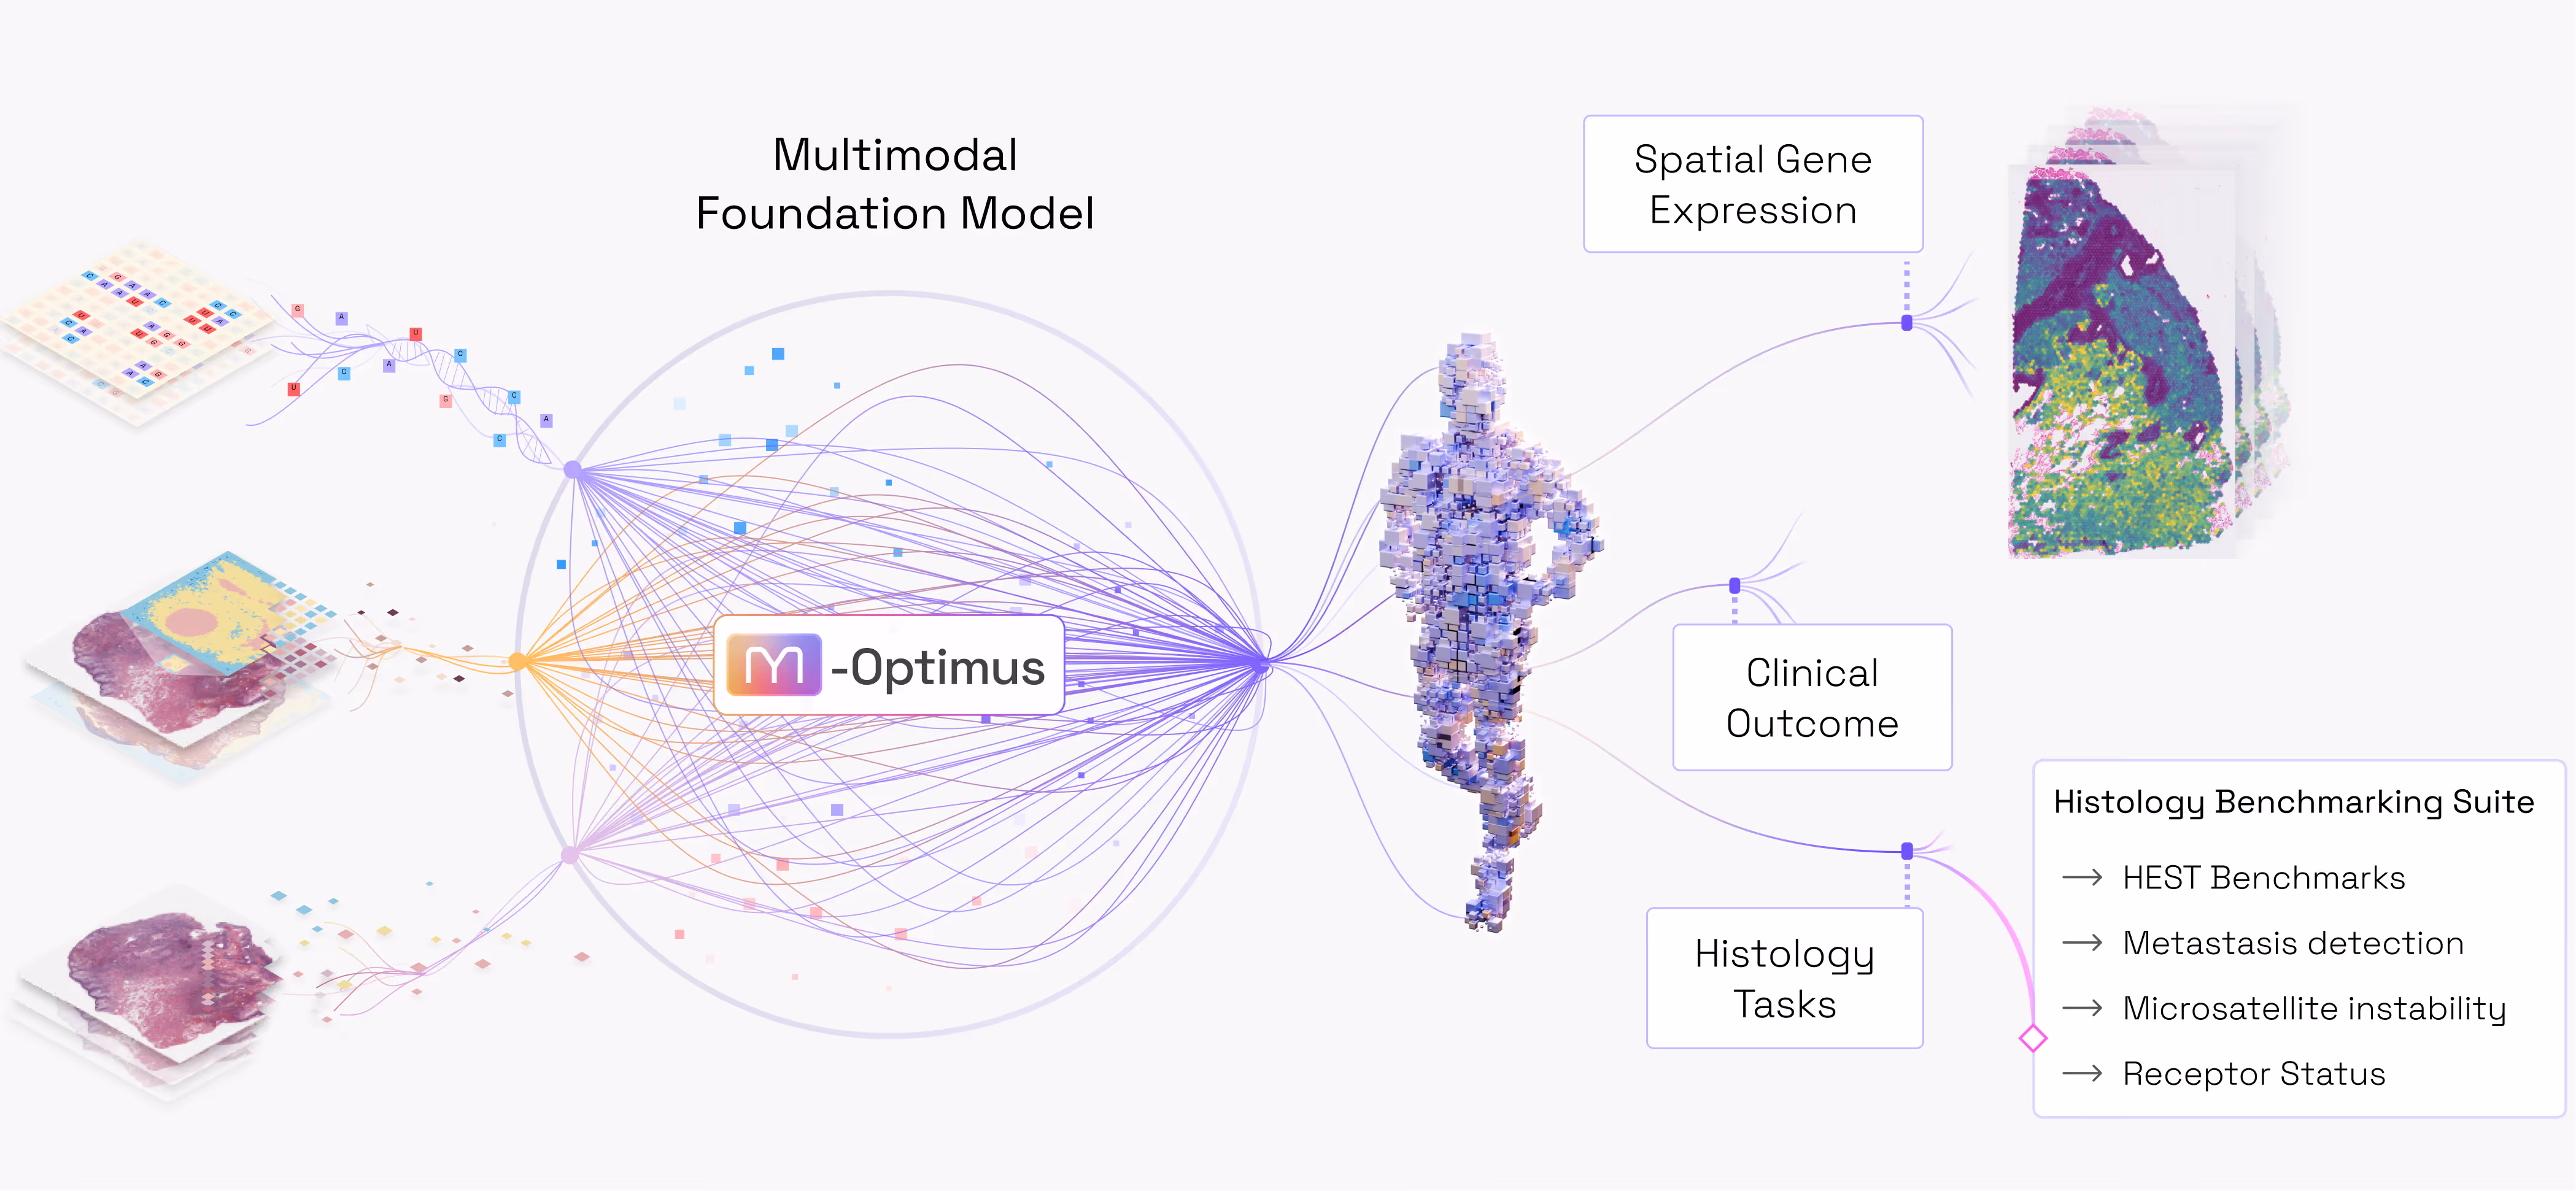
Introducing M-Optimus: one model for biology
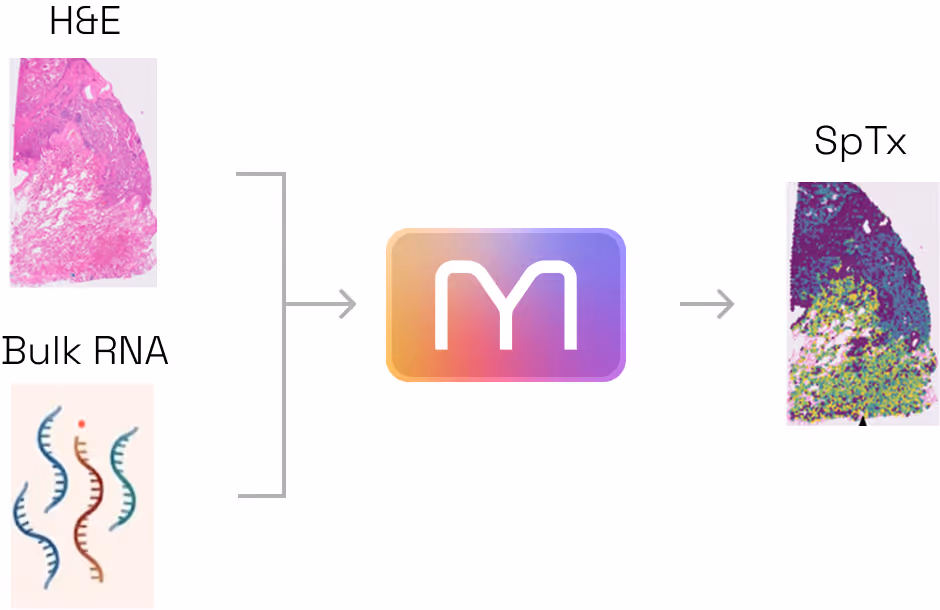
Here we introduce our first major milestone, M-Optimus-1 (M1), a multimodal foundation model designed to combine three distinct biological languages:
  1. H&E Pathology (Hematoxylin & Eosin): he pathology slide image collected from a biopsy or during surgical resection that today represents the primary diagnostic tool at the bedside for physicians. The H&E shows the cellular morphology and architecture of  the tumor.
  2. Bulk RNA-seq: A measure of total gene expression in a sample. This shows what genes that are expressed and the signaling pathways turned on in that tumor and within the organ surrounding the tumor.
  3. Spatial Transcriptomics: A high-definition portrait showing exactly where gene activity is happening. While bulk-RNA gives you an aggregate picture of the genes expressed, spatial transcriptomics shows which cell types are activated, how the patient’s adaptive immune system is reacting to the tumor, and how these cells are interacting at a molecular level with the surrounding tissue.
We chose these three modalities to solve a specific, high-stakes problem in medicine. While H&E images and Bulk RNA data are widely available and affordable, Spatial Transcriptomics is the information rich and state of the art technology yielding rich insights, but its prohibitive cost (roughly $10,000 per specimen) limits its widespread adoption in clinical practice.
M1 changes the economics of biology. By learning how these three layers interact, M1 can reconstruct expensive, high-value molecular info from cheap, routine data. It turns a standard $10 biopsy slide into a deep biological map, paving the way for personalized treatment, targeted therapy adoption, novel combination selection and ultimately faster drug development timelines.
Building a model that can read across these different layers required overcoming two massive hurdles:
  1. The AI Invention. Solving this challenge required moving beyond the limitations of existing AI frameworks. Hence, we developed a proprietary model architecture and training methodology. This new blueprint is uniquely flexible. It converts a patient’s tissue data into a digital feature map that can natively predict the activity of 20,000 genes simultaneously. It can generate these insights from a standard H&E slide alone, or improve its accuracy by incorporating Bulk RNA data when available. This digital foundation can then be easily fine-tuned to predict almost any other property of a tumor.
  2. The Data Moat. To teach an AI to connect these dots, you need "ground truth" data where all three layers are measured on the same patient. While such comprehensive data is notoriously difficult to source, Bioptimus has bridged this gap through strategic partnerships. We trained M1 using a unique proprietary dataset comprising (i) millions of H&E whole slide images from more than 50 organ tissues, and (ii) thousands of patient records where H&E, bulk and spatial transcriptomics are paired and aligned. 
Figure 1: M1 is a multimodal AI trained to understand the relationship between tissue structure (H&E) and gene activity. It converts routine patient data into a digital fingerprint that can be "decoded" into a high-definition spatial map of 20,000 genes. This same fingerprint can be fine-tuned to predict critical tumor properties, such as genetic mutations or clinical outcomes.

M1 performance: the benefits of multimodality

To understand how M1 performs, we put it through a series of rigorous tests. We wanted to see if it could decode the hidden molecular maps within a tissue sample and how it performs versus existing models. We found that multimodality, both at pretraining and inference time, brings significant accuracy gains. Here we highlight the main results and refer the reader to the deep dive section for more details.
1) The 60% Leap
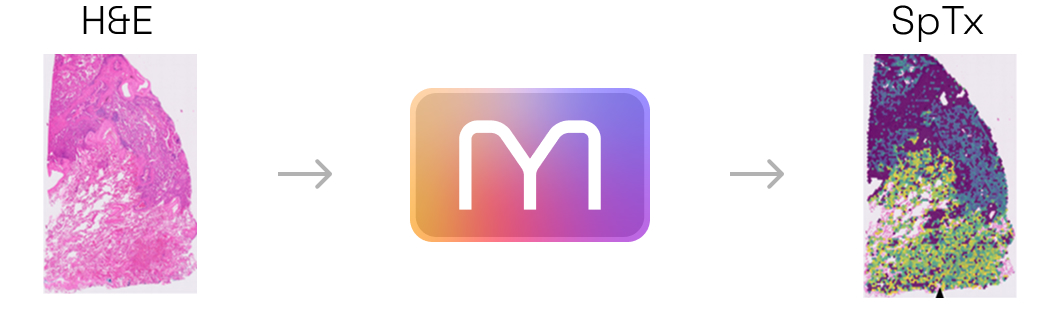
  • Predict SpTx from H&E without fine-tuning
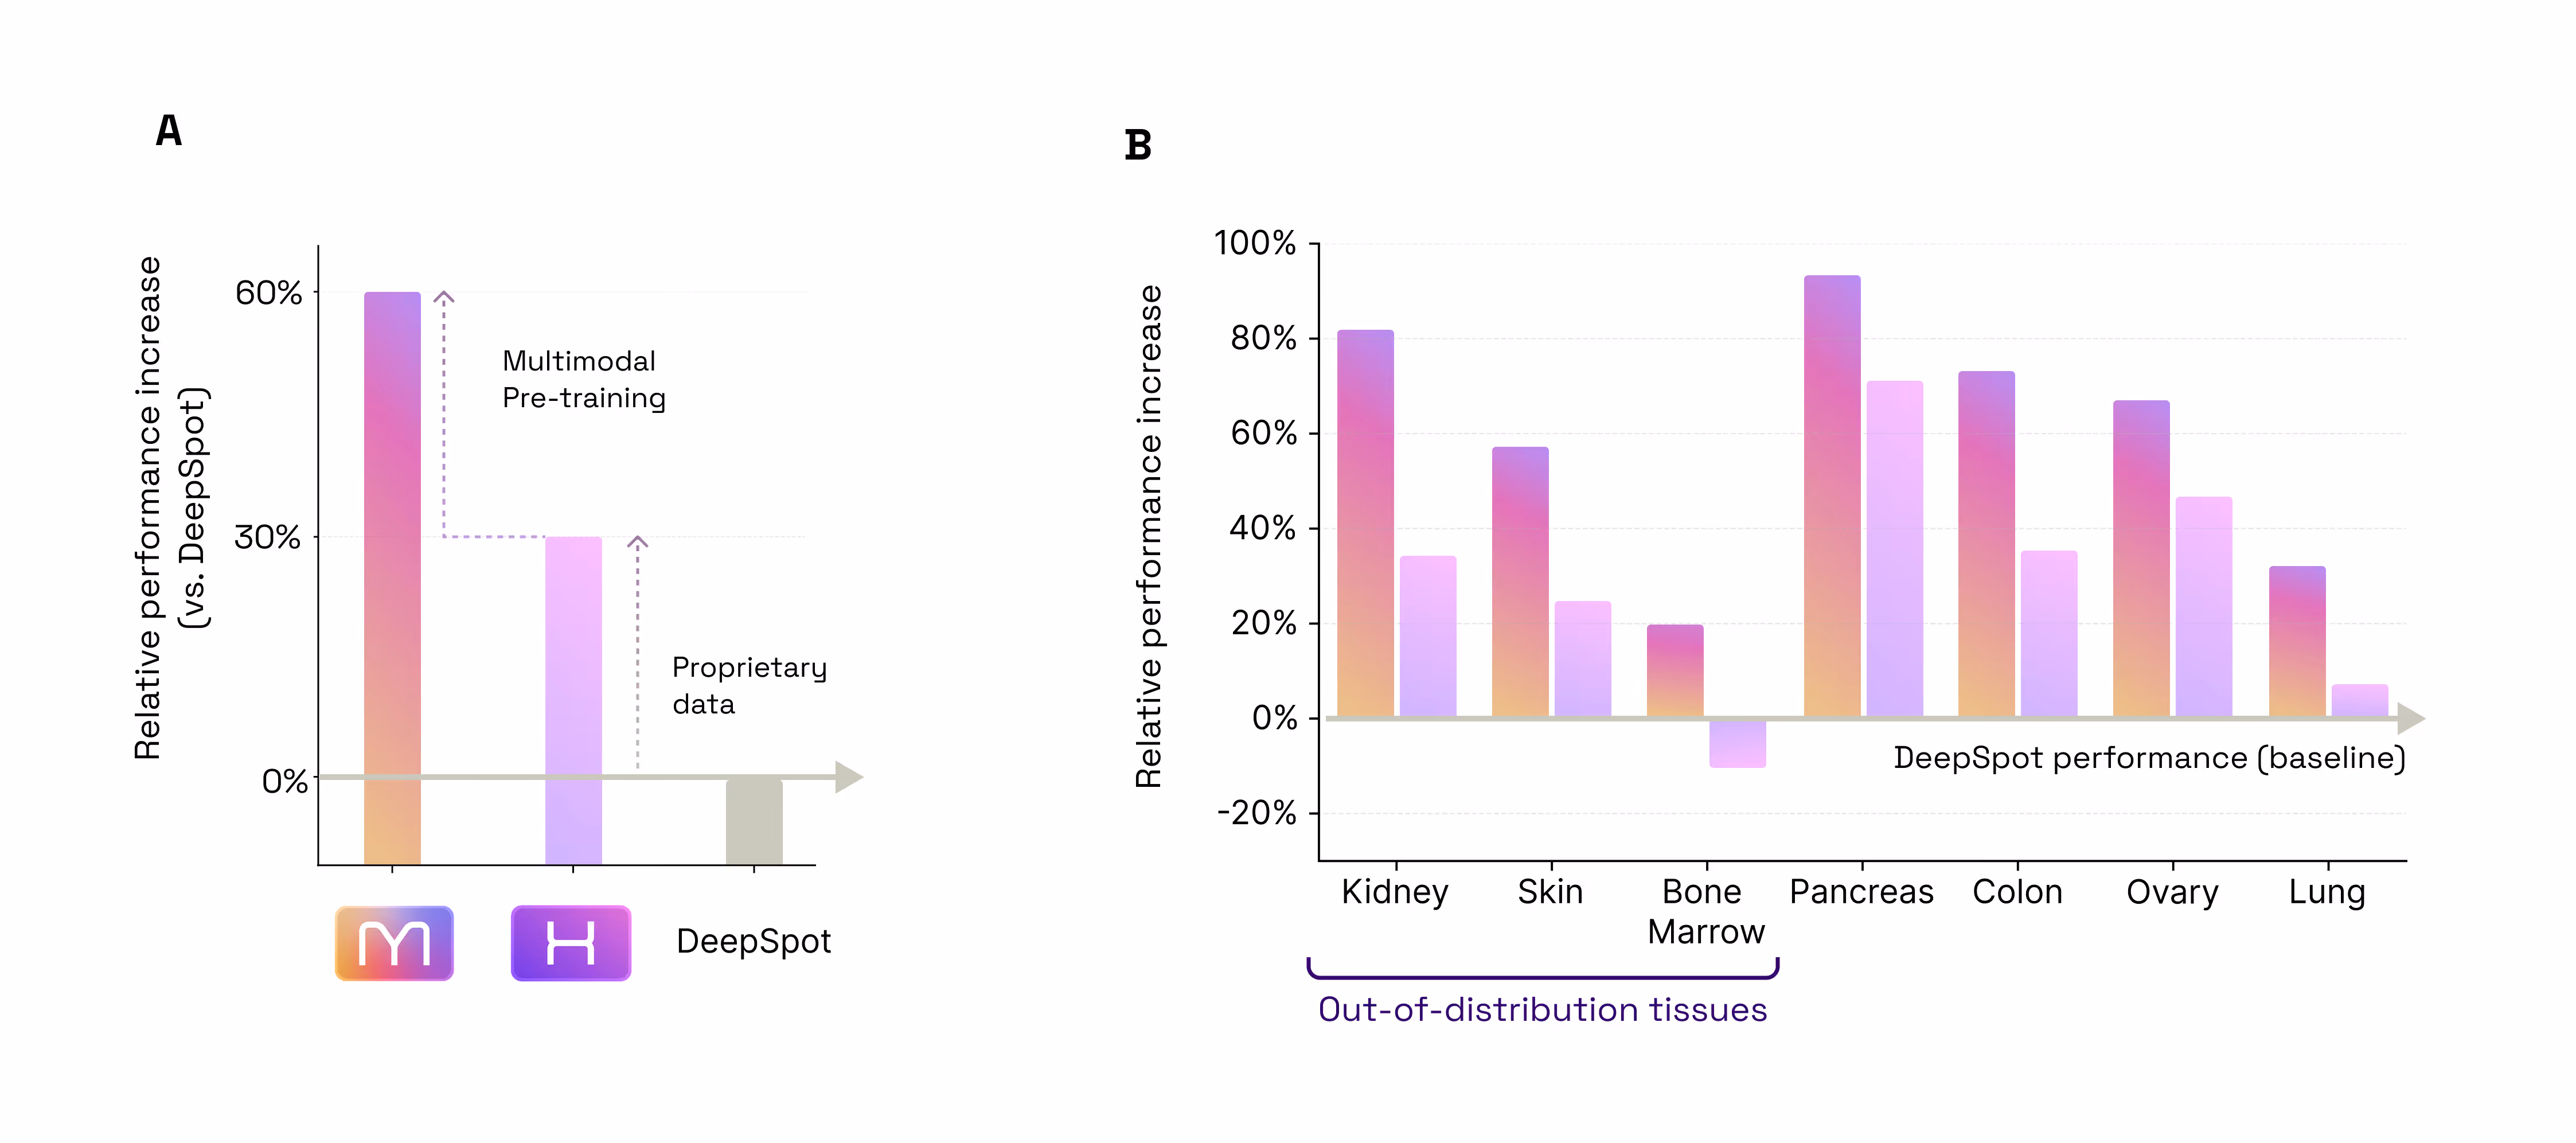
  • +60% accuracy vs gold standard DeepSpot
  • +30% data / +30% multimodal architecture
3) Multimodal training preserves or beats specialization encoding
  • No compromise on H&E encoding
  • M1 outperforms gold standard H1
2) Multimodal inference boost
  • Predict SpTx from H&E+Bulk with no re-training
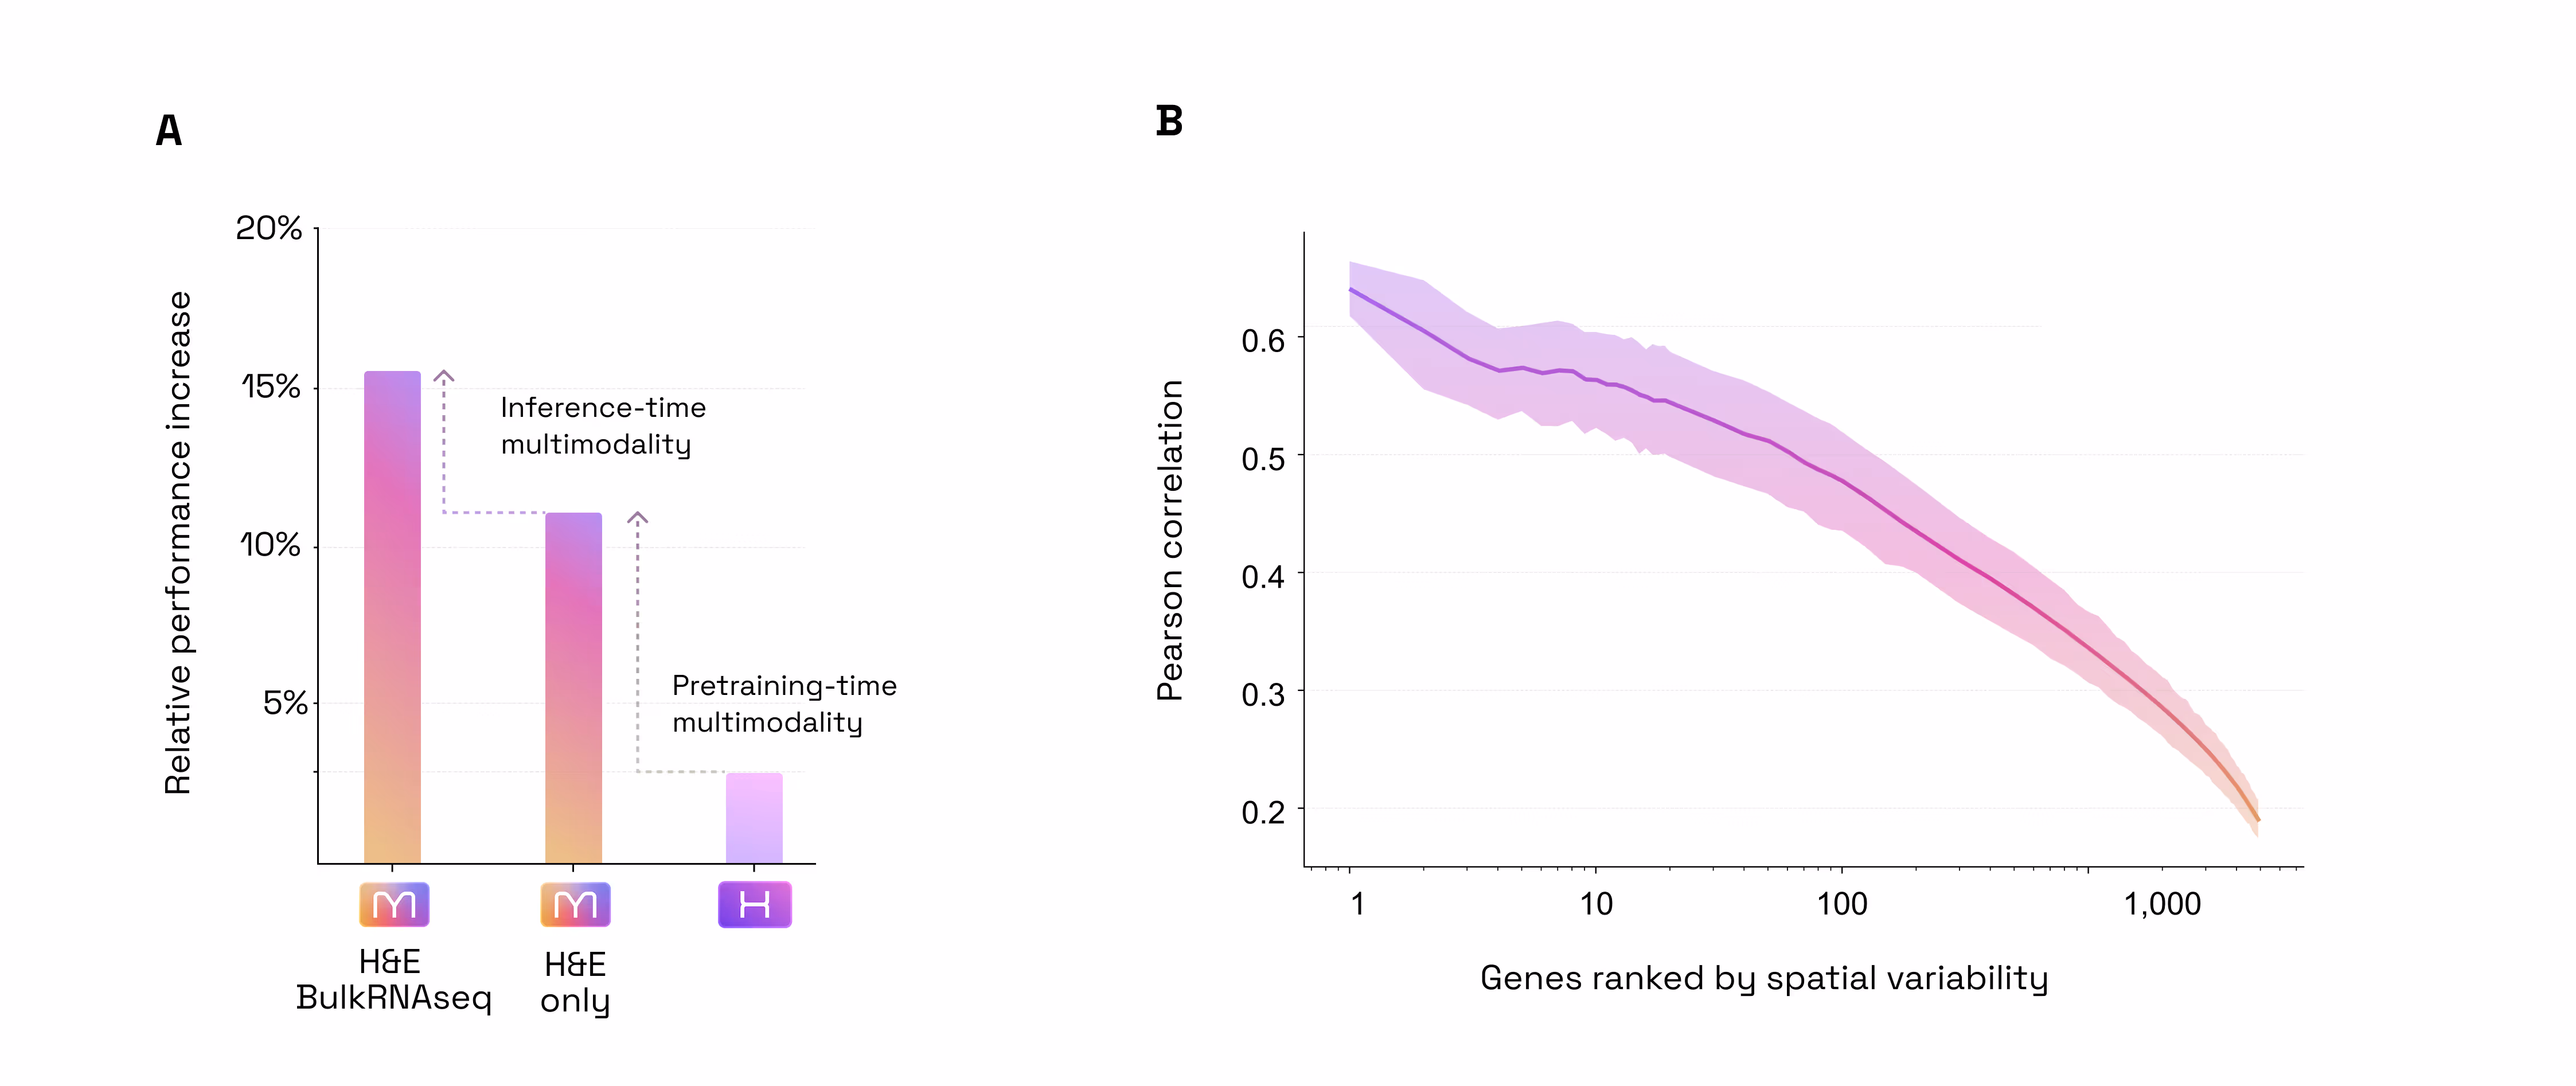
  • +4% accuracy boost when adding Bulk RNA-seq to H&E at inference time
Figure 2: We systematically tested three capabilities of M1 which highlight the benefits of multimodality, both at training time (case 1 and 3, where M1 outperforms gold standard methods for H&E tasks, with or without fine-tuning) and at inference time (case 2, where M1 performance improves when bulk-RNA is added to the H&E image to predict spatial gene expression)
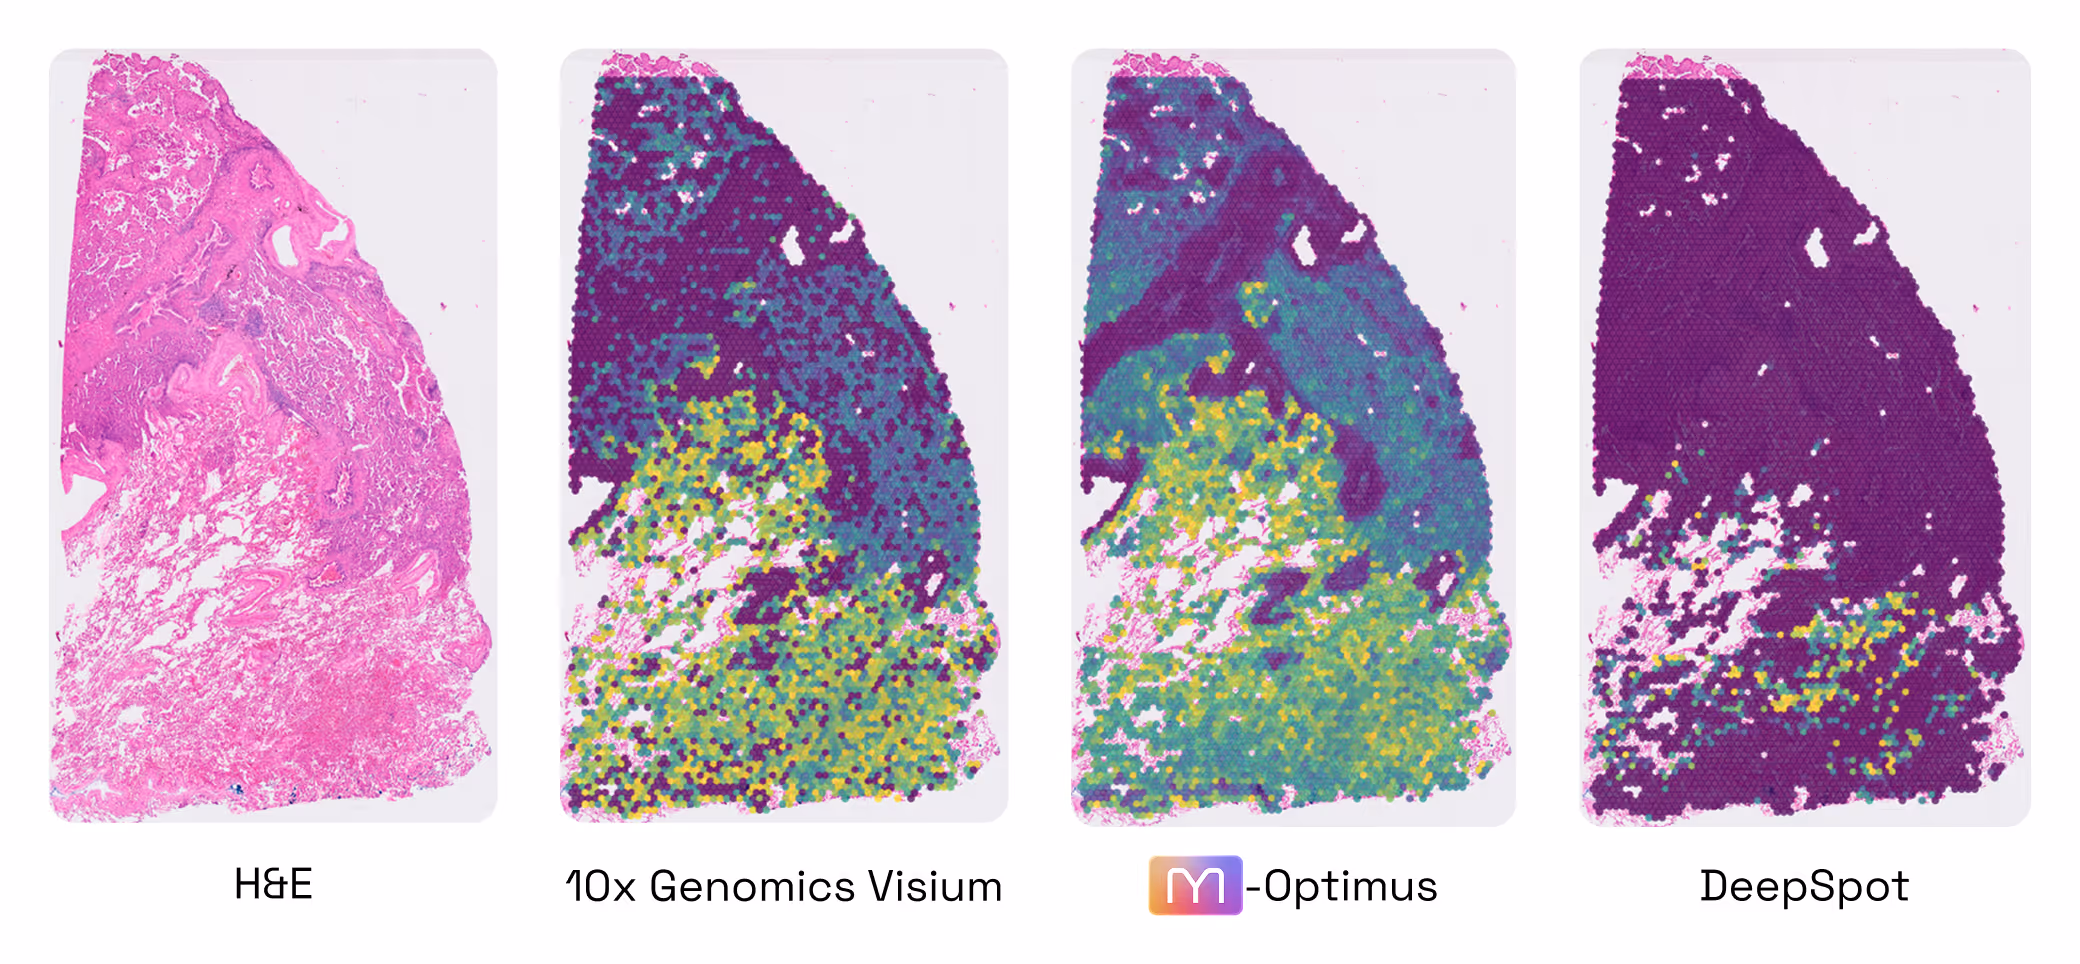
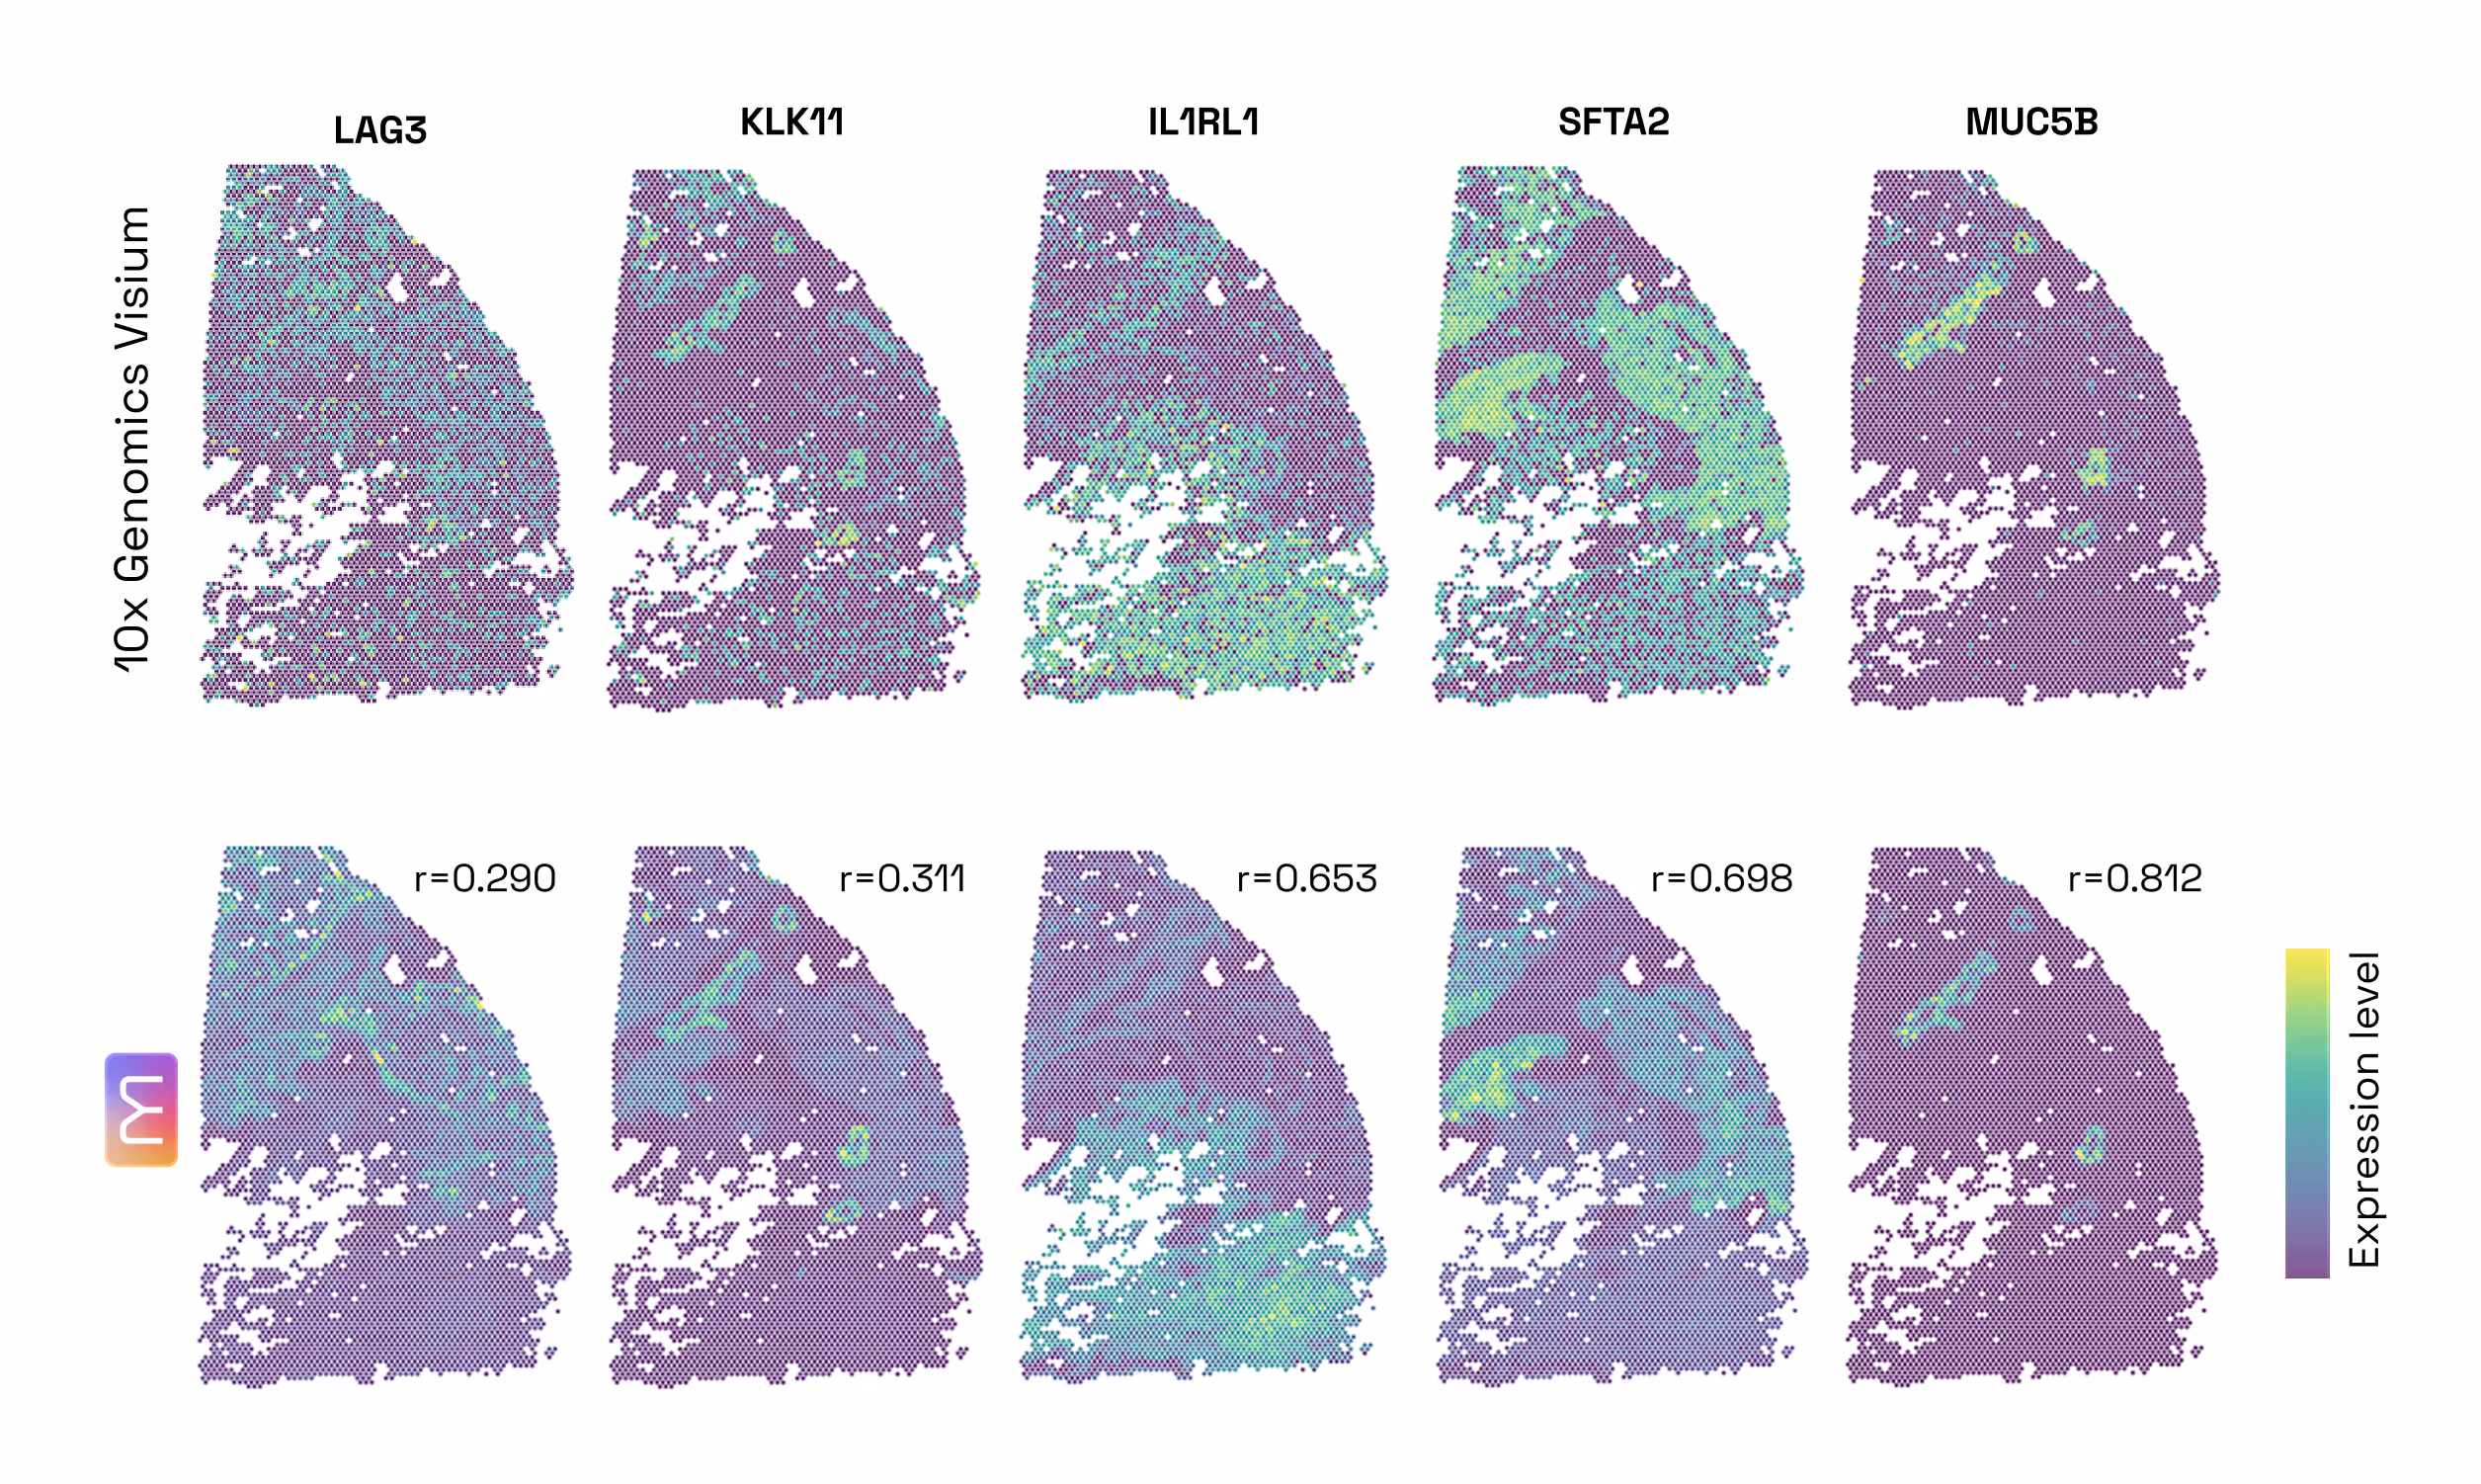
  1. The 60% Leap: Predicting Spatial Gene Expression from H&E. Our first test was a foundational one: Could M1 look at a standard, low-cost H&E slide and accurately predict the activity of 6,000 different genes? When compared to DeepSpot (considered one of the best models in this particular field today), M1 delivered an impressive 60% improvement in accuracy. This leap in performance comes from two sources: 30% from our massive proprietary data, and 30% from our unique multimodal architecture and training method (Figure 2.1).
  2. Multimodal Inference Boost: H&E + Bulk RNA-seq. Most models are limited to the data they see at the moment of inference. M1 is different, it can seamlessly ingest unimodal or multimodal data. Our second test was to assess if M1 benefits from multimodal inputs to predict spatial gene expression. We found that the model naturally "gets smarter" when it is prompted with additional modalities. By adding Bulk RNA-seq data alongside the tissue image at inference time, the model became 4% more accurate than using the image alone (Figure 4). Because it is built to benefit from every fragment of available data, M1 doesn’t require re-training to incorporate this extra context: when available, it simply uses the bulk profile as a "guide" to refine its spatial predictions. (Figure 2.2)
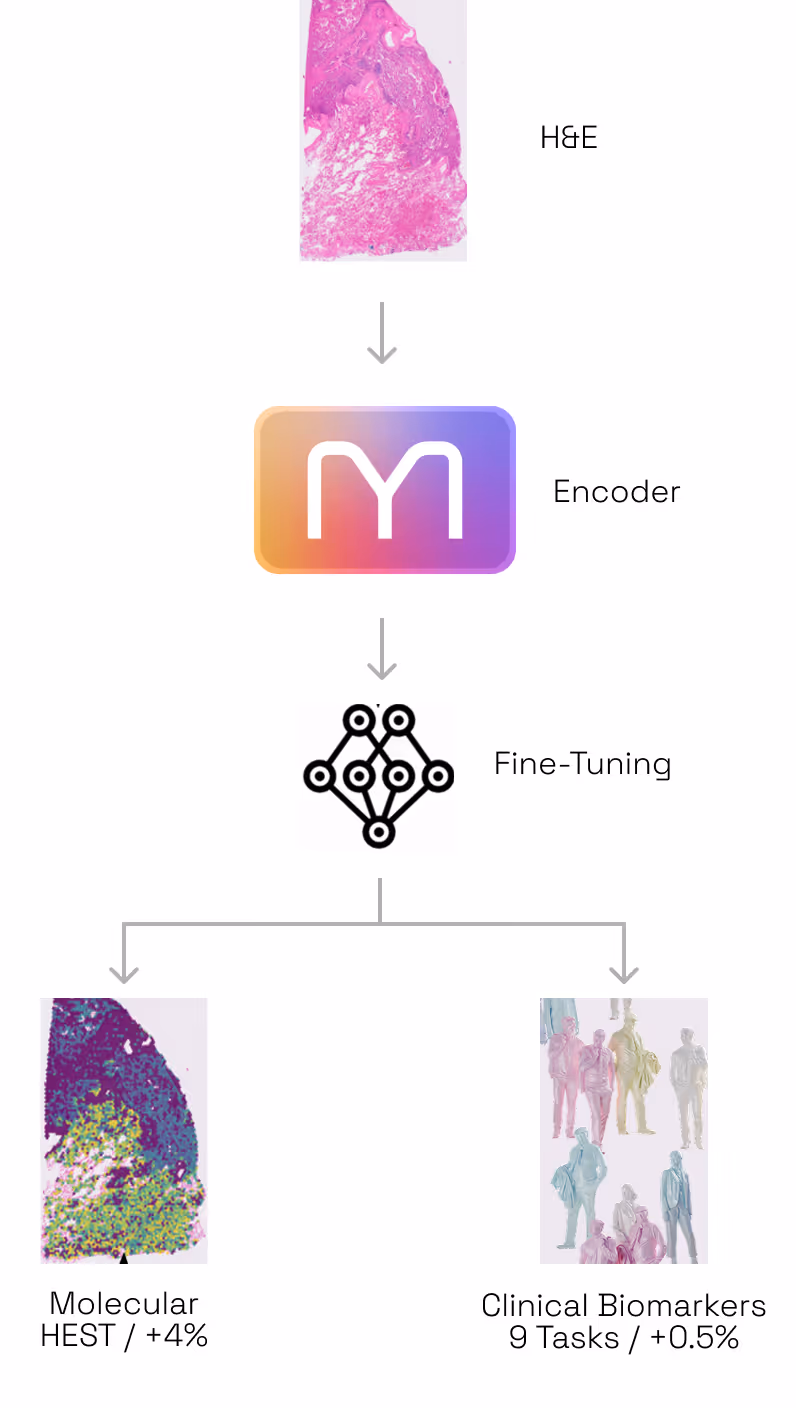
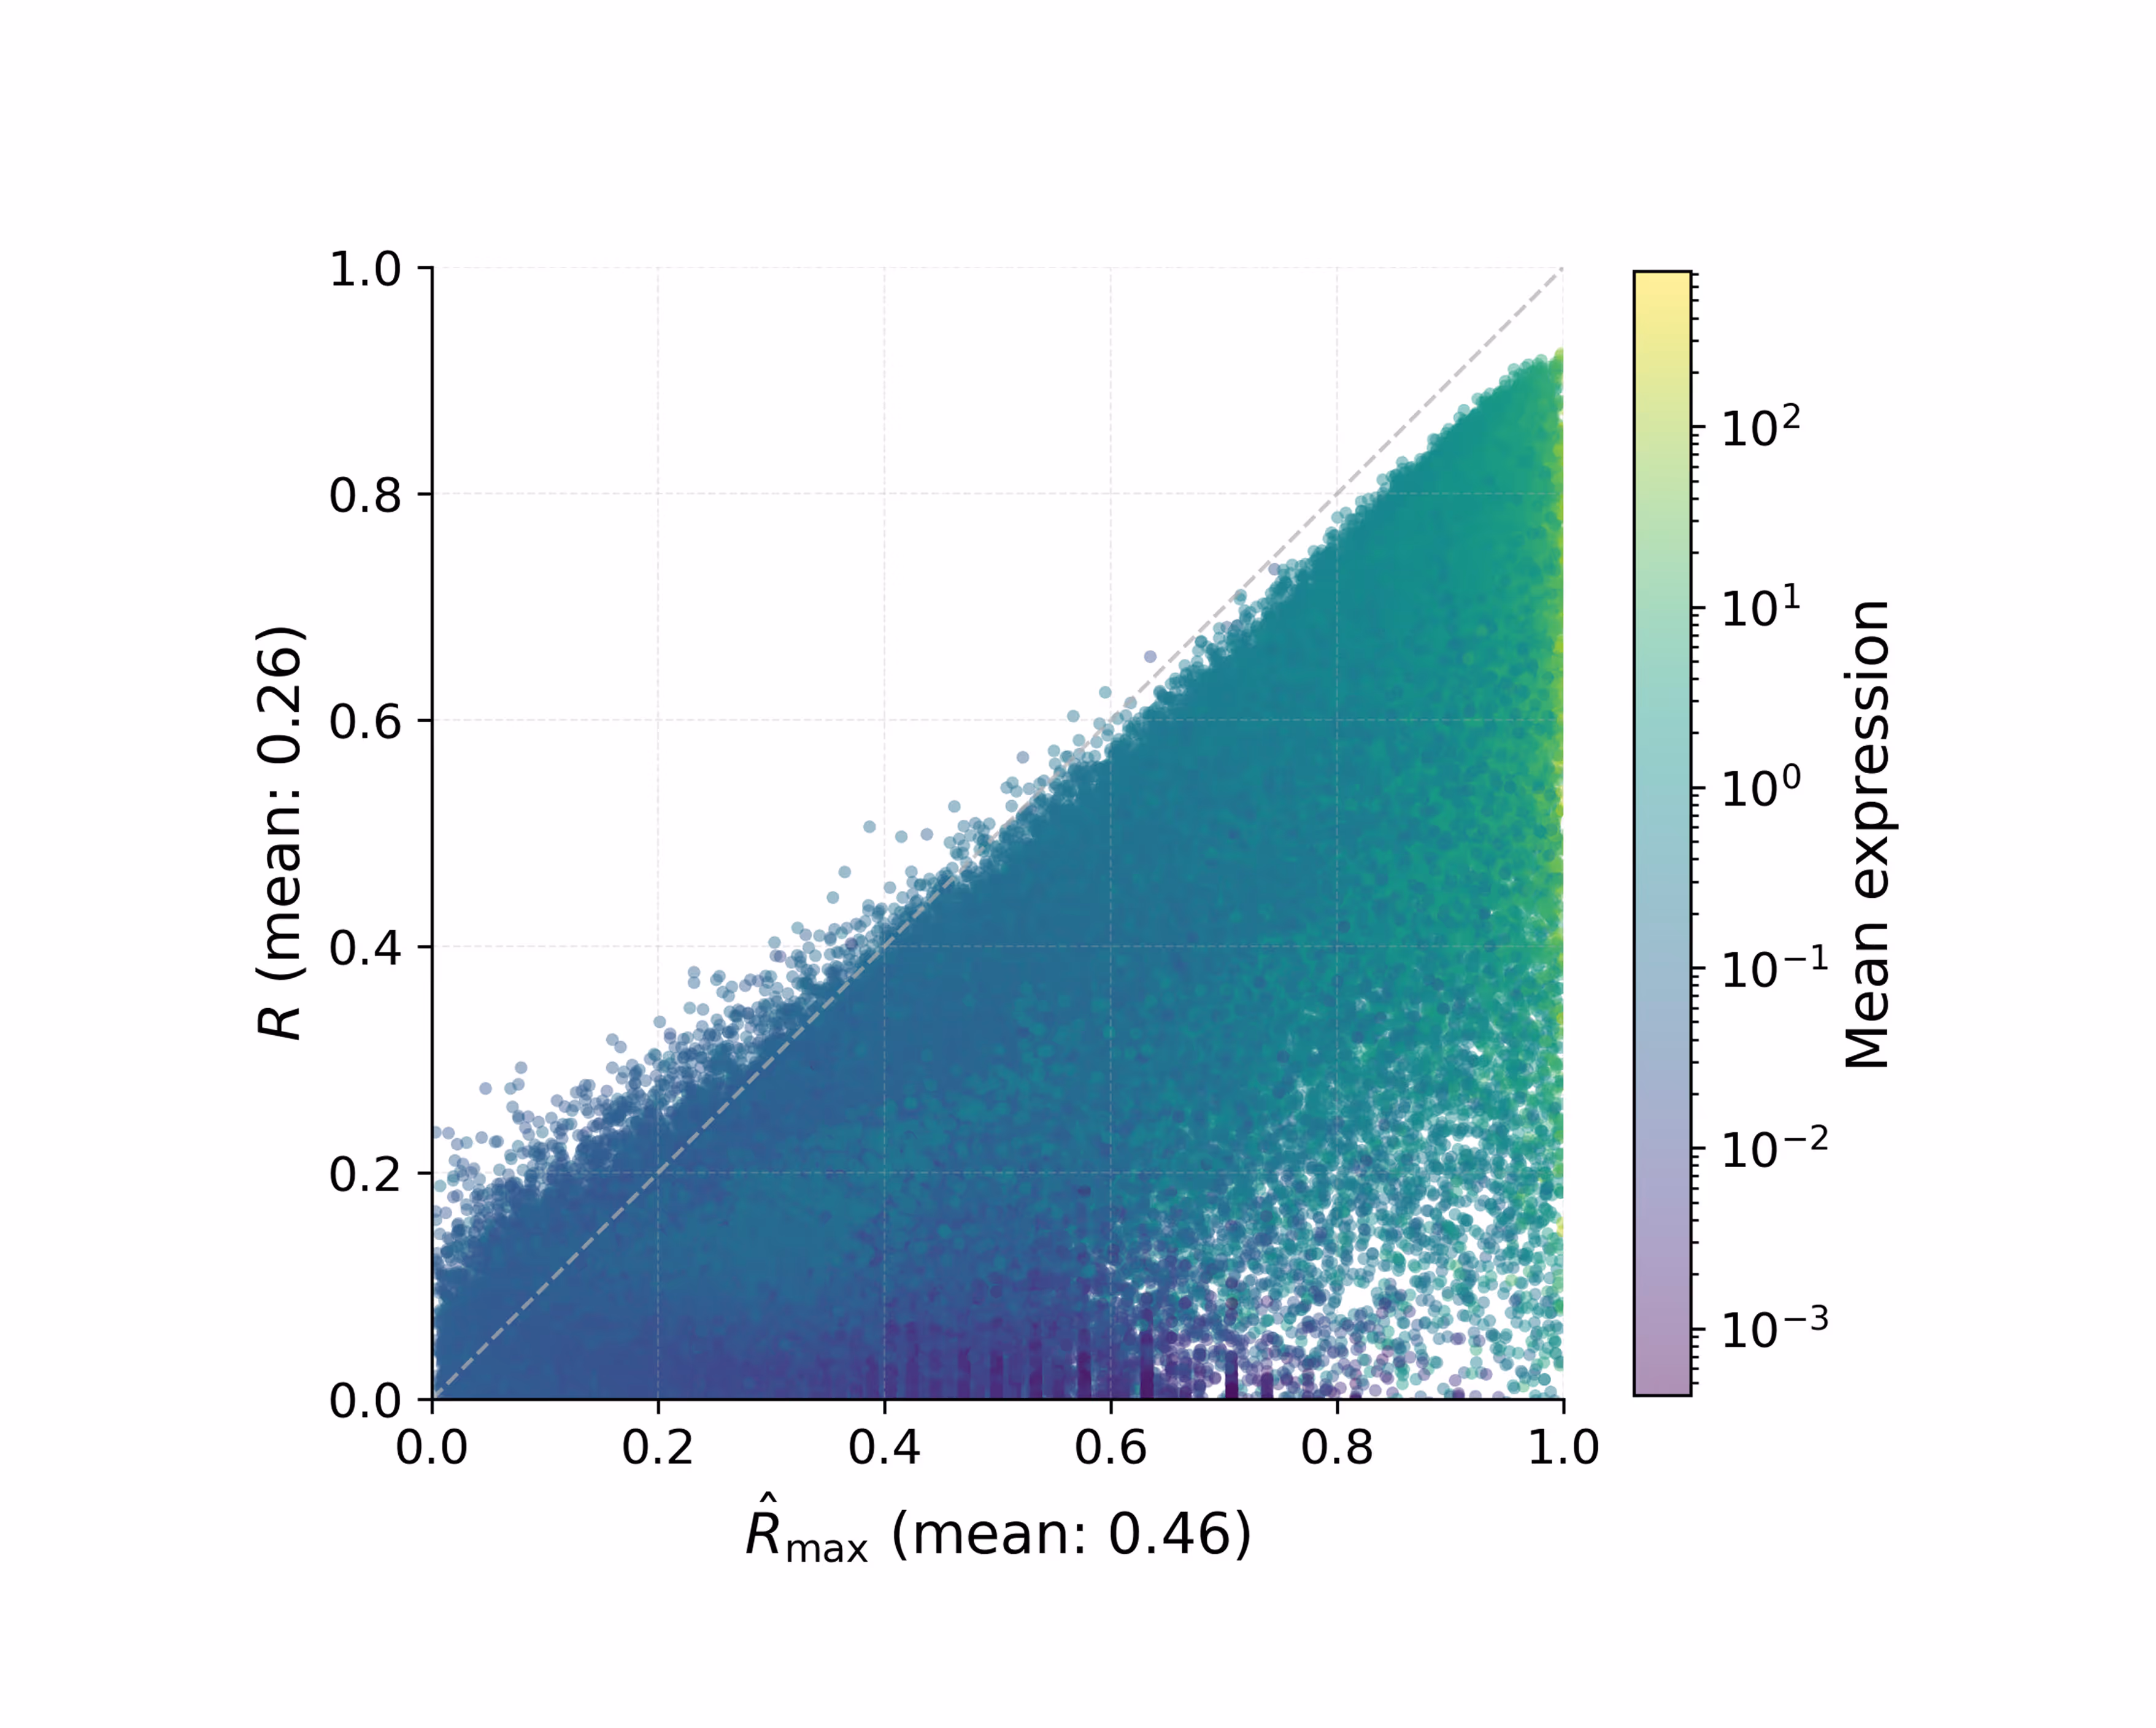
  3. Multimodal Training Preserves or Beats Specialization Encoding: A State-of-the-Art H&E Encoder. A common fear in AI is that adding complexity (like multimodality) degrades performance on simple, unimodal tasks. Our third test was to assess whether M1 is a good generic encoder for H&E images in spite of being trained on multimodal data. For that purpose, we tested M1 against H1, one of the industry's current gold standards for tissue analysis (as of May 2026, H1 is ranked as the #1 foundation model on public leaderboards such as HEST and PathBench) while being pretrained on a set of H&E images very similar to that used by M1. On the HEST benchmark (predicting gene expression), M1 outperformed H1 by ~4% (average Pearson correlation 0.440 vs 0.423). This confirms that by training on multiple modalities, M1 has developed a "sharper eye" for subtle morphological and molecular details that image-only models can’t resolve. When it comes to the bread and butter of pathology, predicting tumor subtypes, mutations, or whether a cancer has spread, M1 matched the performance of H1 (mean AUC across 9 tasks: 0.664 vs 0.661). Overall, this proves that M1 doesn't trade-off basic diagnostic power for molecular insight; it enhances the former while mastering the latter (Figure 2.3).
In absolute terms, we found that M1 captures on average more than 50% of the total predictable biology when it predicts spatial gene expression. This effectively turns every H&E slide into a high-resolution, in silico molecular map.
Figure 3: Prediction of spatial gene expression from an H&E slide, comparison of M1, H-Optimus fine-tuned on the same data as M1, and DeepSpot (see deep dive for details). (A) M-Optimus outperforms DeepSpot by +60%: +30% is due to the use of rich proprietary data used to pretrain M1 (H1 vs Deepspot), +30% is due to the multimodal pretraining methodology (M1 vs H1). (B) M1 consistently outperforms the competing models across the seven tissue types of the dataset.
Deep Dive: How we measure performance and what the scores mean
Evaluation structure.
We evaluate M1 in two settings: first on spatial gene expression prediction, then on standard histopathology benchmarks to verify that multimodal training does not degrade performance on tasks requiring only visual morphology.
M1 can run on an H&E slide alone or combine the slide with bulk RNA-seq when available. While M1 can predict expression across the whole transcriptome of over 20,000 genes, we focus our evaluations on a curated pan-tissue gene panel of over 6,000 genes, covering tumor and immune cell biomarkers, cell-cell interactions, ligands and receptors, biological pathways, and drug candidates, some of the biological dependencies most relevant to oncology research and used in optimizing patient treatment.
Quantifying success in spatial transcriptomics prediction is a notoriously difficult task (Wang et al., 2025). The field has not yet converged on consensus benchmarks for multimodal models. Different systems use different gene panels, spatial resolutions, and evaluation protocols, making direct comparison challenging. Thus, we evaluate across multiple complementary settings, spanning in-distribution and out-of-distribution data, different measurement technologies, and both quantitative gene-level prediction and downstream diagnostic tasks.
The benchmarks:
Challenging internal out-of-distribution dataset (OOD). 18 held-out tissue slides across seven cancer types, with ground-truth spatial gene expression measured using 10x Genomics Xenium (a different spatial technology from the one M1 was trained on). Tests whether M1 holds up on tissues, sites, and technologies it was never trained against.
“In-distribution” held-out test set (IND). A fraction of patients from our proprietary cohort is held out during training. Used only to compare differently-trained Bioptimus models; follows the same distribution in terms of tissues, sites, and technology as the training data.
A public community leaderboard - histopathology benchmarking suite. Includes (a) eight standard H&E slide-level benchmarks spanning colorectal, gastric, and breast cancers; and (b) the HEST benchmark (Jaume et al., 2024), a public and independent community benchmark for H&E-to-spatial-transcriptomics prediction across nine indications.
The reference models:
DeepSpot (Nonchev et al., 2025): a publicly available state of the art model for spot-level spatial transcriptomics from H&E, using H-Optimus-0 as backbone, trained on one or two indications with up to 36 slides.
H-Optimus-1: our own unimodal H&E-only foundation model, fine-tuned on the same proprietary dataset as M1 to isolate the contribution of multimodality. With over 1.3M downloads as of May 2026, our H-Optimus series has established itself among the most performant histopathology foundation models globally. 
How we score.
To focus on meaningful spatial variation in molecular signals rather than technical artifacts, we normalize both the predicted and the measured gene expression by their respective total count per spot and apply a shifted log transformation. For each slide and gene, we compute the Pearson correlation across spots within the slide. The resulting values are averaged across slides to give one value per gene. This computation focuses on intra-slide spatial variation, setting a higher bar than cross-slide comparisons.
Putting the scores in context.
We compute correlations against noisy measurements of gene expression. Even experimental replicates of the same tissue section do not correlate perfectly. A model that perfectly predicted the underlying biological reality would still achieve a correlation substantially lower than 1. A recent paper (Schmauch et al., 2025)  formalized this upper bound and derived an empirical estimate for the maximum achievable correlation based on the noise level of the data. M1 achieves, on average, more than half of the estimated maximum correlation according to this framework (See Deep Dive Figure 1).
Deep Dive Figure 1: Observed correlations between M1’s predictions and experimental data (y-axis) vs theoretical ceiling (x-axis), following the framework in (Schmauch et al., 2025). Each point is a gene. M1 captures a substantial part of the theoretically available signal.
Advantage of multimodality.
On the held-out IND test dataset, M1 outperforms the unimodal H-Optimus-1 baseline with paired bulk RNA-seq by up to 16% (Figure 4A). Crucially, this advantage persists in the H&E-only setting, where M1 still significantly improves over the baseline despite receiving no bulk RNA-seq at inference time. Performance is correlated with the spatial variability of a gene: M1 excels at genes with clear, non-random spatial expression patterns, as measured by Moran’s I (Figure 4B).
Histopathology evaluations.
A critical question for any multimodal model is whether extending training to additional modalities compromises H&E performance. We find that multimodal training improves molecularly informed tasks and preserves visual-morphological ones. On Figure 5A, for HEST1k, M1 outperforms H-Optimus-1 across all nine tasks. On Figure 5B, M1 matches H-Optimus-1 in AUROC across eight conventional slide-level pathology tasks (metastasis detection, microsatellite instability, BRAF and KRAS mutation calls, and ER/HER2/PR receptor status).
Figure 4: Results over over held-out IND dataset. (A) Multimodality leads to a boost in performance for spatial gene expression prediction: Relative improvement of M-Optimus-1 vs. H-Optimus-1: +16% multimodal, +12% H&E-only. (B) Pearson correlation of 6,000 genes ranked by spatial variability.

The Universal Language of Biology: Why a Generalist Beats the Specialists

In medical research, the conventional wisdom has always been that if you want to study a specific disease, you build a model of that specific disease. The assumption was that biology is too varied between organs for a generalist to ever beat a specialist. M1 proves that this assumption is wrong.
1) Generalists outperform specialists
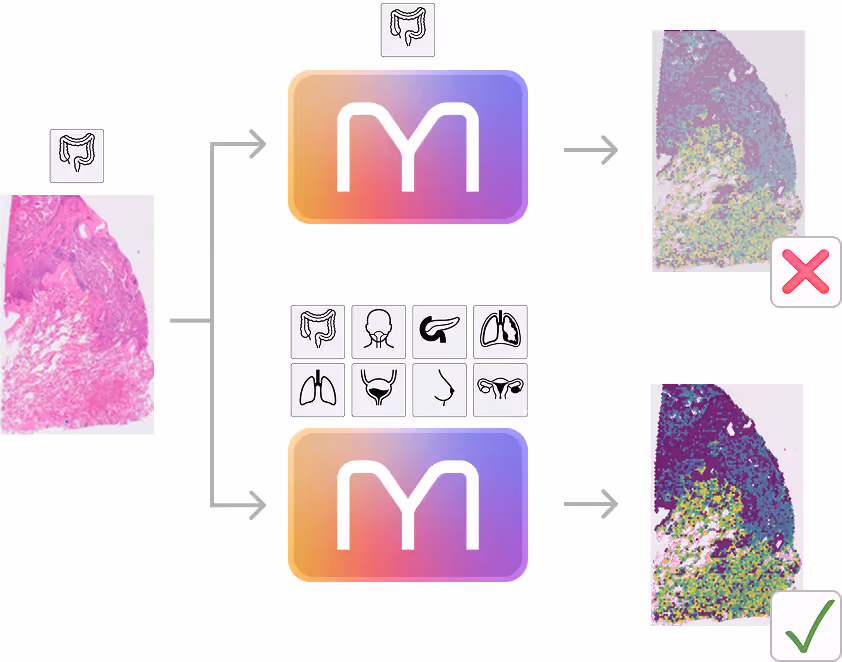
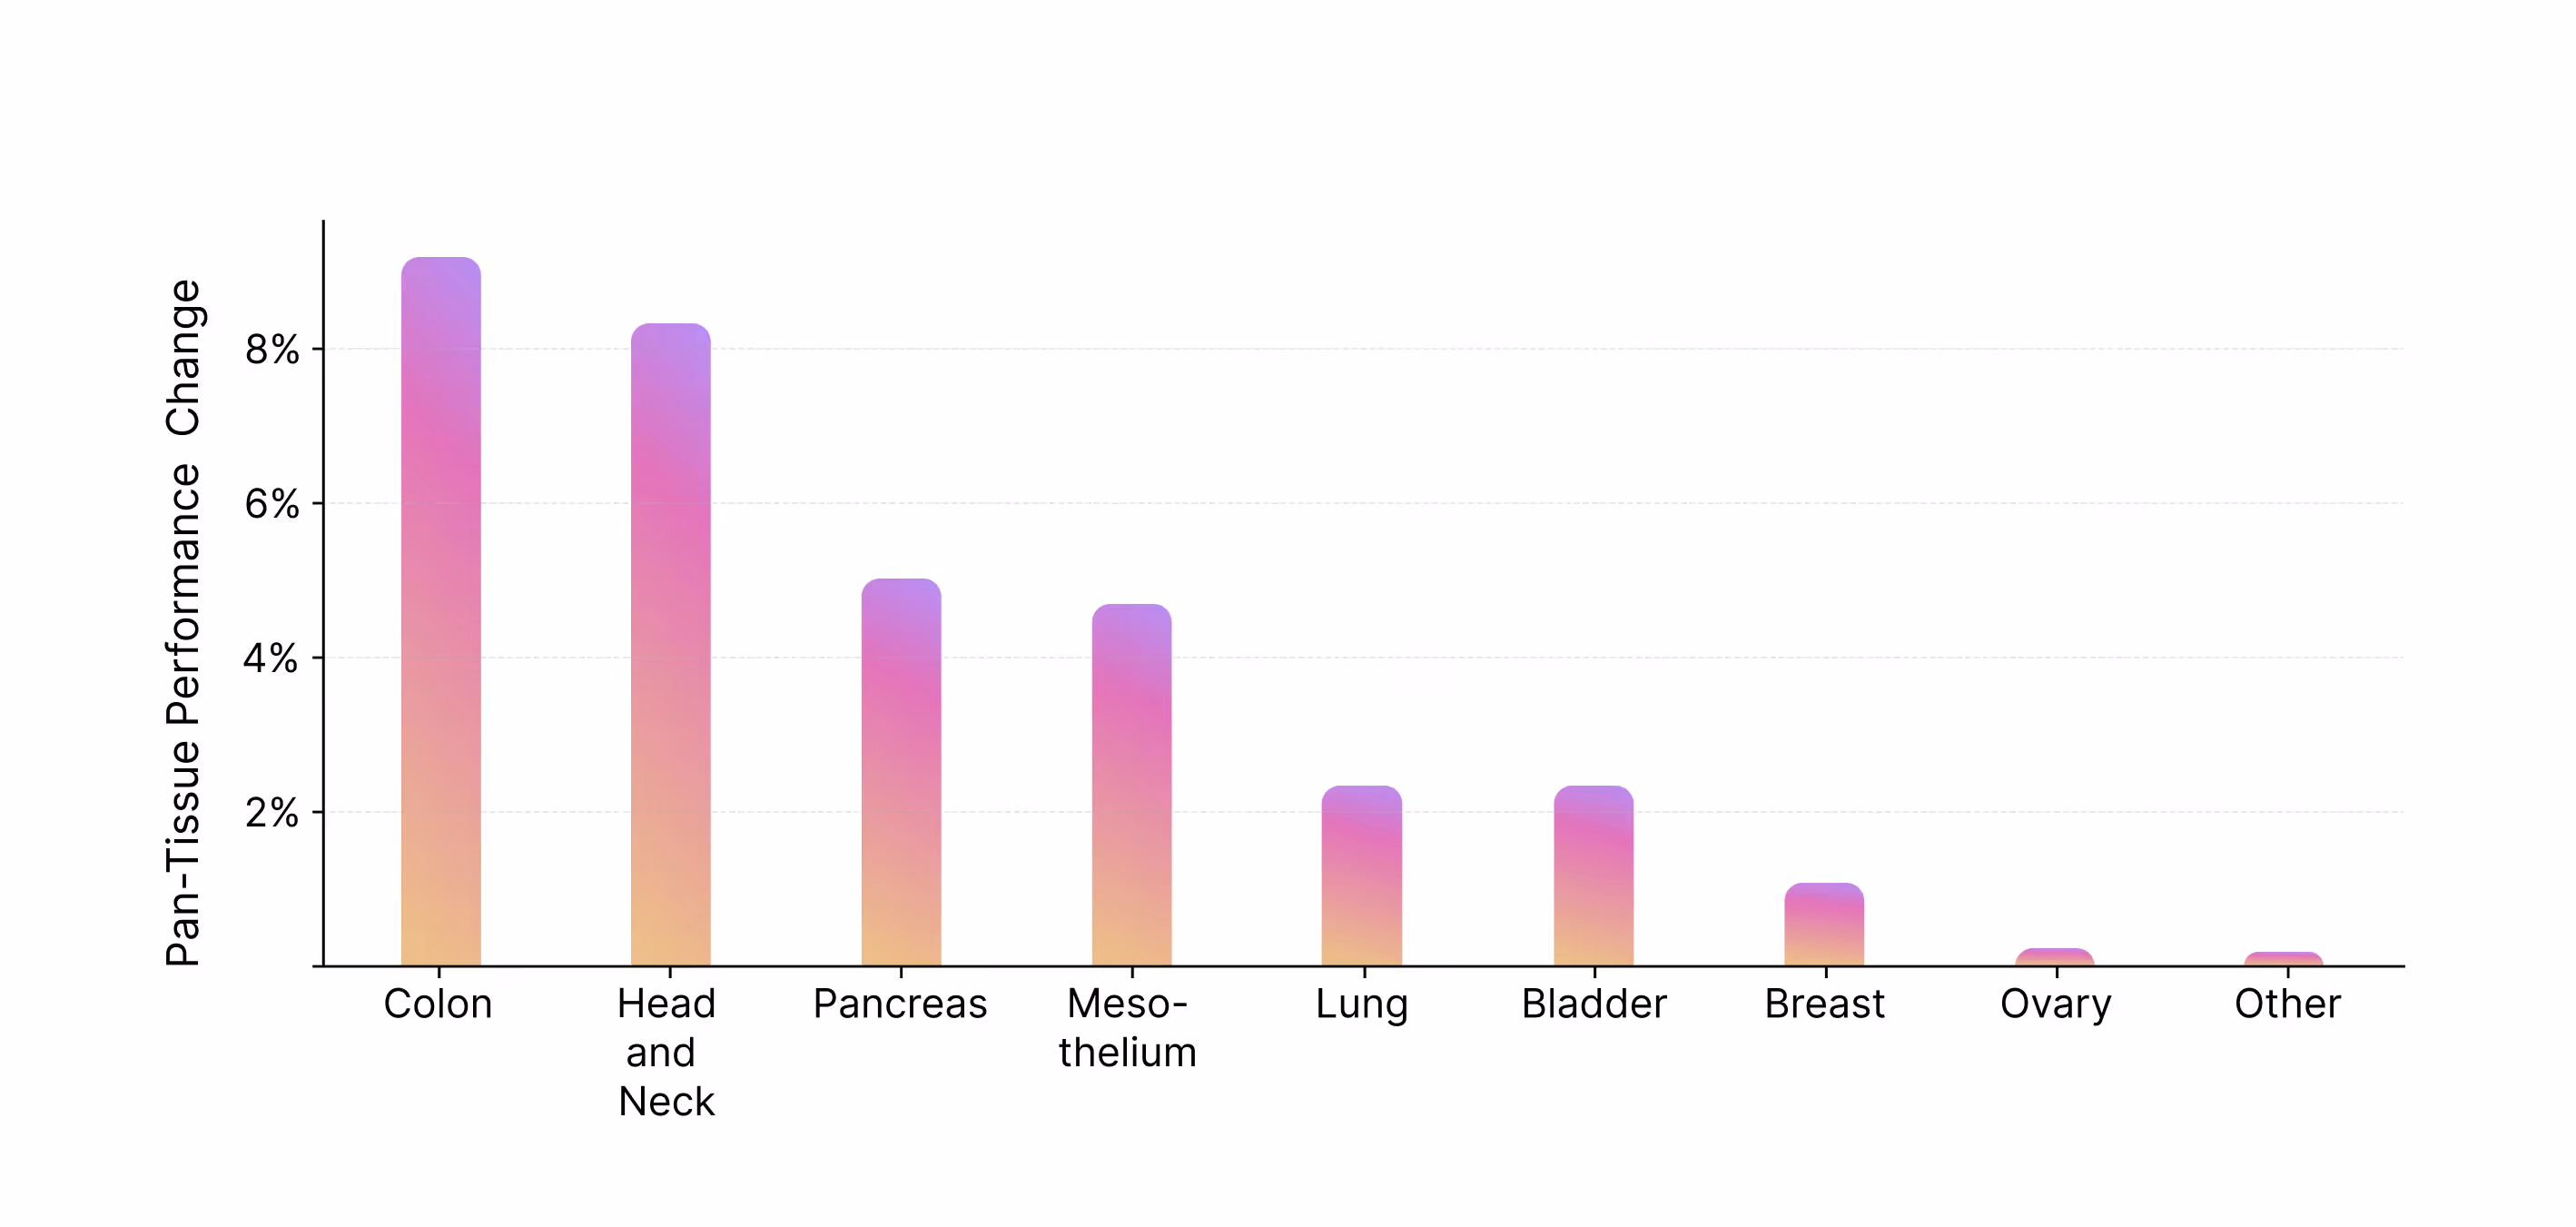
  • M1 transfers knowledge between indications
  • +8% on Colon and Head & Neck cancers for the generalist vs specialist model
2) Seeing the unseen
  • Zero-shot generalization capabilities
  • M1 outperforms specialist models (here DeepSpot) on indications it has never seen before
Figure 5: M1 learns biology across indications and improves when it is trained as a generalist model with data from diverse tissue types (case 1). It can then generalize to indications it has never seen before (such as kidney or skin tissues) and outperform models specifically trained on these indications (case 2). 
The Shared Language of Biology
While a lung cell and a skin cell look different, they share the same underlying machinery. Immune cells, blood vessels, and the way tumors interact with their surroundings follow similar rules across the entire body. We hypothesized that by training on the full diversity of human tissues, M1 would learn a universal grammar of biology. This allows it to transfer knowledge from one cancer type to another, recognizing patterns that a narrow specialist would simply miss, such as how gene activity shifts at the tumor's edge or how specific immune niches form.
The Evidence: M1 Beats the Specialists
The data bears this out. As shown on Figure 6, M1 outperformed specialized models across most cancer types. On colon and head and neck cancer, the improvement reaches more than 8%. By seeing the big picture, M1 learned to translate patterns across diseases, clinical sites, and even measurement technologies it had never encountered during training.
But the true test of a foundation model isn't just doing better on known tasks—it’s its ability to handle the unknown.
Zero-Shot Generalization: Seeing the Unseen
A common critique of AI is that it merely parrots its training data. To test this, we evaluated M1 on cancer types completely absent from its training set, including kidney, skin, and bone marrow cancers.
The results were striking: the performance gains over DeepSpot held steady (Figure 3B), although DeepSpot had specialized models pretrained on kidney and skin melanoma samples. This zero-shot generalization suggests that M1 has internalized fundamental biological laws, allowing it to provide high-fidelity insights into tissues it has literally never seen before.
Unlocking New Research Frontiers
This validated pan-tissue capability moves us beyond simple diagnostic tools and opens the door to high-impact research questions that were previously out of reach. How does the immune landscape in a rare disease translate to diseases for which we have already designed well-working therapies? Can groupings and stratifications learned from a large, well-characterised cohort be extended to make sense of a smaller, data-sparse one? Both questions are for example crucial in the context of drug repurposing (finding new uses for medicines already on the market).
By proving that a single model can outperform a collection of specialists, we are providing a tool that can navigate the entire map of human disease, even the parts that haven't been charted yet.
M-Optimus learns a unified pan-tissue representation:
Figure 6: Results over held-out IND dataset. A pan-tissue model is better than an indication-specific model. Percentage change with respect to corresponding indication-specific models, as measured by average Pearson correlation across genes and samples.
Deep Dive: Generalization in detail
Pan-cancer generalization. We compared a global model (trained on the complete dataset) with specialized models trained exclusively on data from a single indication. All models were evaluated on held-out samples from the corresponding indication. The global model performs favourably in all but one case (Glioblastoma, an outlier with very different cellular origins compared to other tested cancers). 
Site generalization. Every hospital runs pathology differently. Sample preparation, staining, scanner hardware, and annotation conventions all vary subtly between institutions. We compared a cross-site model against site-specific models across five clinical sites. The cross-site model matches or outperforms site-specific models at every site. Exposure to diverse clinical environments during training makes the model portable rather than brittle.
Technology generalization. M1 was trained on Visium data. On held-out 10x Genomics Xenium data, M1 outperforms both H-Optimus-1 and DeepSpot in a zero-shot setting, without task-specific fine-tuning. This data represents a different spatial technology with another measurement process and resolution, coming from clinical sites largely absent from training. The improvement over DeepSpot on skin and kidney tissue that M1 never saw during training can be attributed to the substantially larger and more diverse multimodal pretraining dataset (Figure 3B).

Predicting biology that was previously invisible

The biggest difference between M1 and existing models cannot be captured by a single benchmark score. What matters most is what it unlocks for translational researchers, drug developers and clinicians. M1 enables accurate spatial gene expression predictions for many established drug targets, cell-type markers and actionable biomarkers, directly from routine H&E slides. And M1's capabilities extend far beyond well-studied panels, giving it the power to accelerate research at the frontier.
To understand what this means in practice, consider a concrete example.
Take the SFTPD gene in lung cancer. SFTPD encodes for surfactant protein D and recent research suggests SFTPD could play a critical role in tumor immunity by recruiting T-cells to transform immunologically “cold” tumors into “hot” ones, reducing the number of metastases and improving overall survival. By mapping these complex immune markers in their precise spatial context, M1 helps researchers directly link local expression patterns to patient outcomes, such as predicting how patients with specific mutations (like EFGR) will respond to targeted therapies.
The gap between M1 and the well-established reference model DeepSpot result becomes more tangible when you look at the maps side by side.
Given a routine H&E slide of lung adenocarcinoma (Figure 7A), M1 provides a prediction of SFTPD (Figure 7C) that closely matches the experimental ground truth (Figure 7B). In contrast, a well-established reference model (Figure 7D) was virtually incapable of inferring even the coarsest aspects of this pattern, losing the biological signal to noise. When the biological map is flawed, any downstream analysis, whether cell-type identification or biomarker discovery, is compromised.
Lung adenocarcinoma - SFTPD:
Figure 7: M1 infers fine-grained spatial gene expression patterns. (A) H&E slide of a lung adenocarcinoma section. (B) SFTPD expression as measured by 10x Visium / ground truth. (C)   M1 predicted expression. (D) A well-established external model fails to recapitulate this spatial gene expression pattern from the same input.
This is not an isolated example. The same capability applies across thousands of genes.
M1 correctly predicts where thousands of genes are active across a tumor. Prediction performance varies (Figure 8), but we see that even for genes that are less well predicted (r < 0.4) the model shows meaningful spatial structures of that gene against ground truth. As a result, researchers can now explore spatial signatures for patient stratification from a routine slide, just by using M1, without the need to run an expensive assay. Or, when a drug fails in a clinical trial, researchers can return to the patient cohort and examine whether the tumor microenvironment contained suppressive factors that prevented the drug from functioning as expected. This kind of retrospective spatial analysis is available for any cohort, without requiring new tissue collection or prospective assay data.
Figure 8: M1 predicted spatial gene expression patterns behind the correlation coefficient. Even genes with lower correlation values can correspond to meaningful, spatially coherent predictions (r = pearson correlation). 
Deep Dive: SFTPD and what this means biologically
Why spatial patterns matter. Tumor biology is heterogenous and varies strongly between and within patients. Bulk RNA-seq simplifies this diversity into one number per gene. Understanding tumor substructures at larger scales enables novel insights and connects patient outcomes to differences in patient groups that could not previously be explained (See Figure 7).
SFTPD in lung adenocarcinoma. The pulmonary surfactant protein D (SP-D) encoded by SFTPD is involved in the innate immune response in the lung. A recent study (Mohammedi et al., 2026) shows that high expression levels are associated with better patient survival due to a lower number of metastases. Especially in patients with EGFR mutations, high SFTPD expression is predictive of survival for patients treated with tyrosine kinase inhibitors (Umeda et al., 2017). In other cancer types, SFTPD activates anti-tumor macrophages that recruit cytotoxic T-cells into the tumor microenvironment, turning it from an immunologically “cold tumor” into a “hot tumor” (Ganguly et al., 2022). M1 enables analysis of these markers in spatial context, helping to understand differences in expression and linking them to patient survival.

What this means for drug discovery today

M1 is already being deployed with our partners to solve high-stakes drug discovery and development questions. Far from being a simple research tool, this first-iteration model acts as a biological intelligence layer that transforms raw data into actionable insights, providing immediate value across the R&D lifecycle. This includes:
Multimodal Biomarkers: Higher Sensitivity for Patient Response.
01

Traditional biomarkers are often unimodal—either a specific genetic mutation or a visual pathology score (like PD-L1). M1 enables the creation of multimodal digital biomarkers. By combining the structural context of H&E with the depth of Bulk RNA-seq, M1 identifies complex "signatures" of drug response that neither modality could catch alone. This leads to higher sensitivity in patient stratification and a reduced risk of trial failure.

Resurrecting Legacy Clinical Trials
02

Millions of existing pathology slides from historical trials represent a gold mine of untapped data. Many of these trials lack spatial molecular data because the technology didn't exist or tissue was too scarce. M1 allows researchers to perform retrospective molecular analysis at scale, virtually enriching old cohorts with spatial gene expression profiles. By linking these new maps to known long-term outcomes, we can discover why some patients responded years before we had the tools to understand their biology.

The "$10 Precision Medicine" Filter
03

Precision medicine is currently bottlenecked by the cost of assays. At roughly $10 for a routine H&E slide, M1 acts as a high-fidelity first-pass filter. Instead of committing $10,000 per sample for spatial transcriptomics across an entire cohort, researchers can use M1 to screen thousands of patients and then target expensive wet-lab assays only on the most informative samples. This makes 1,000-patient spatial studies financially and logistically viable for the first time.

"In Silico" Tissue Augmentation and Experimental Design
04

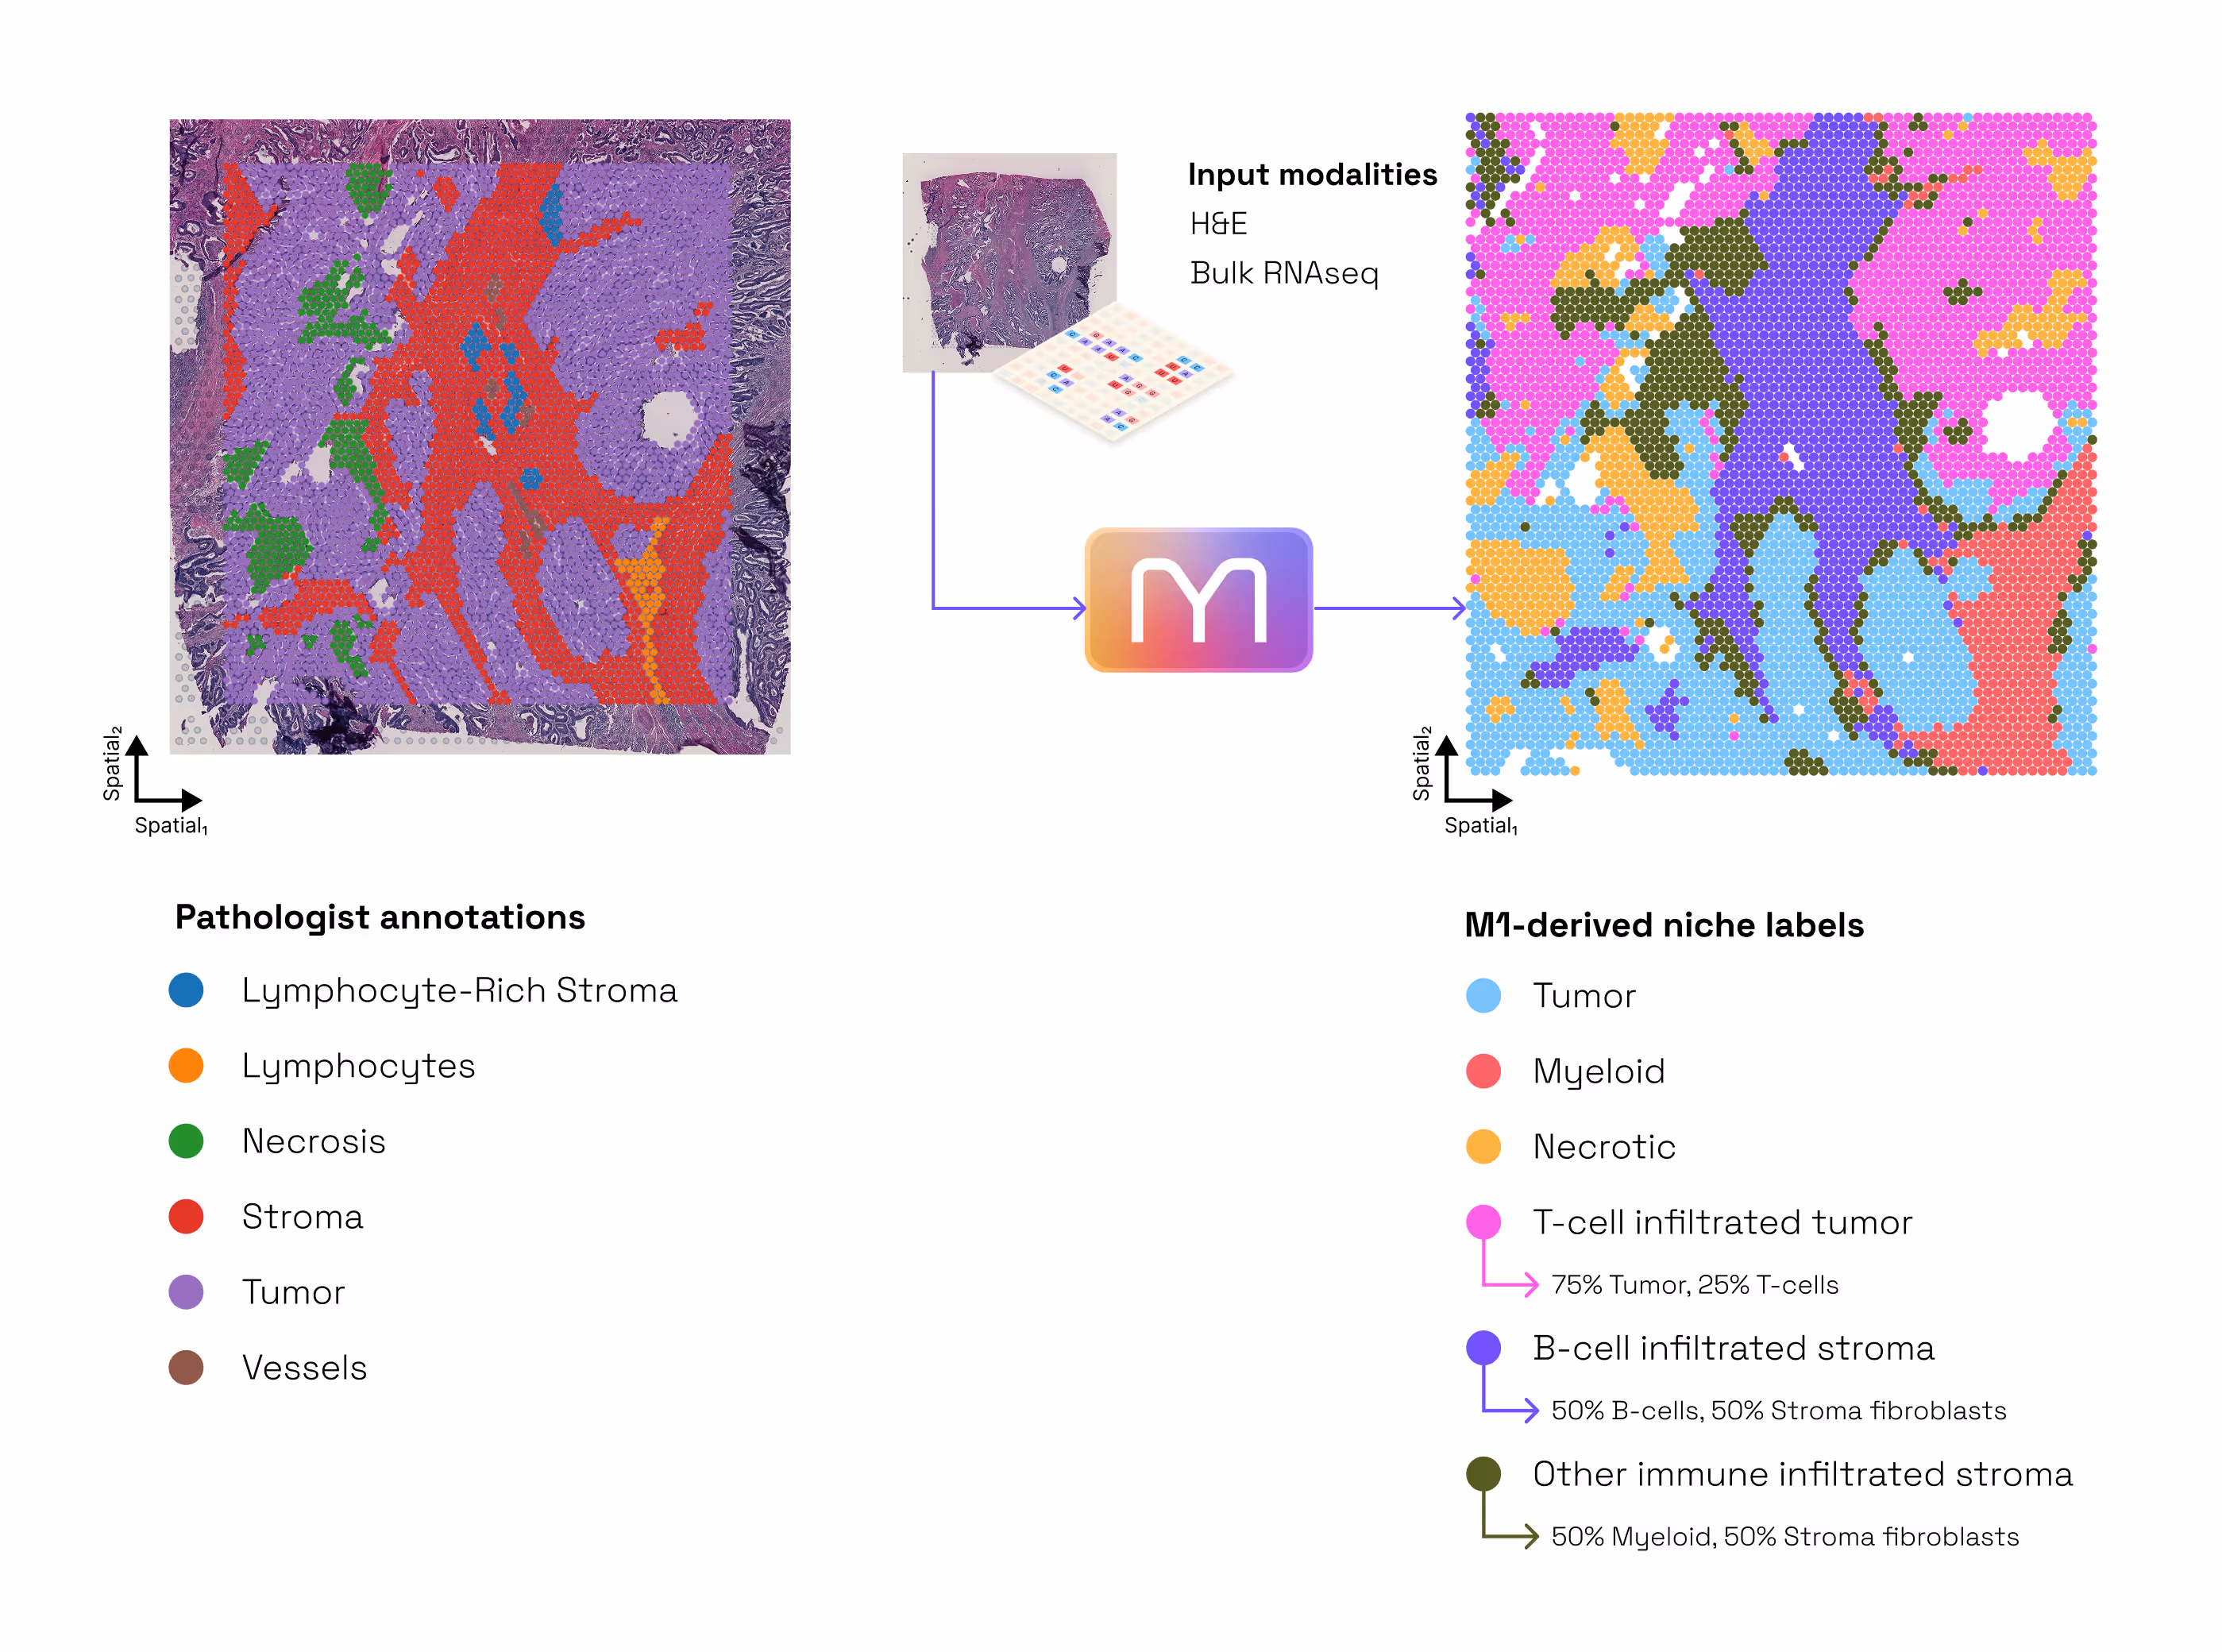
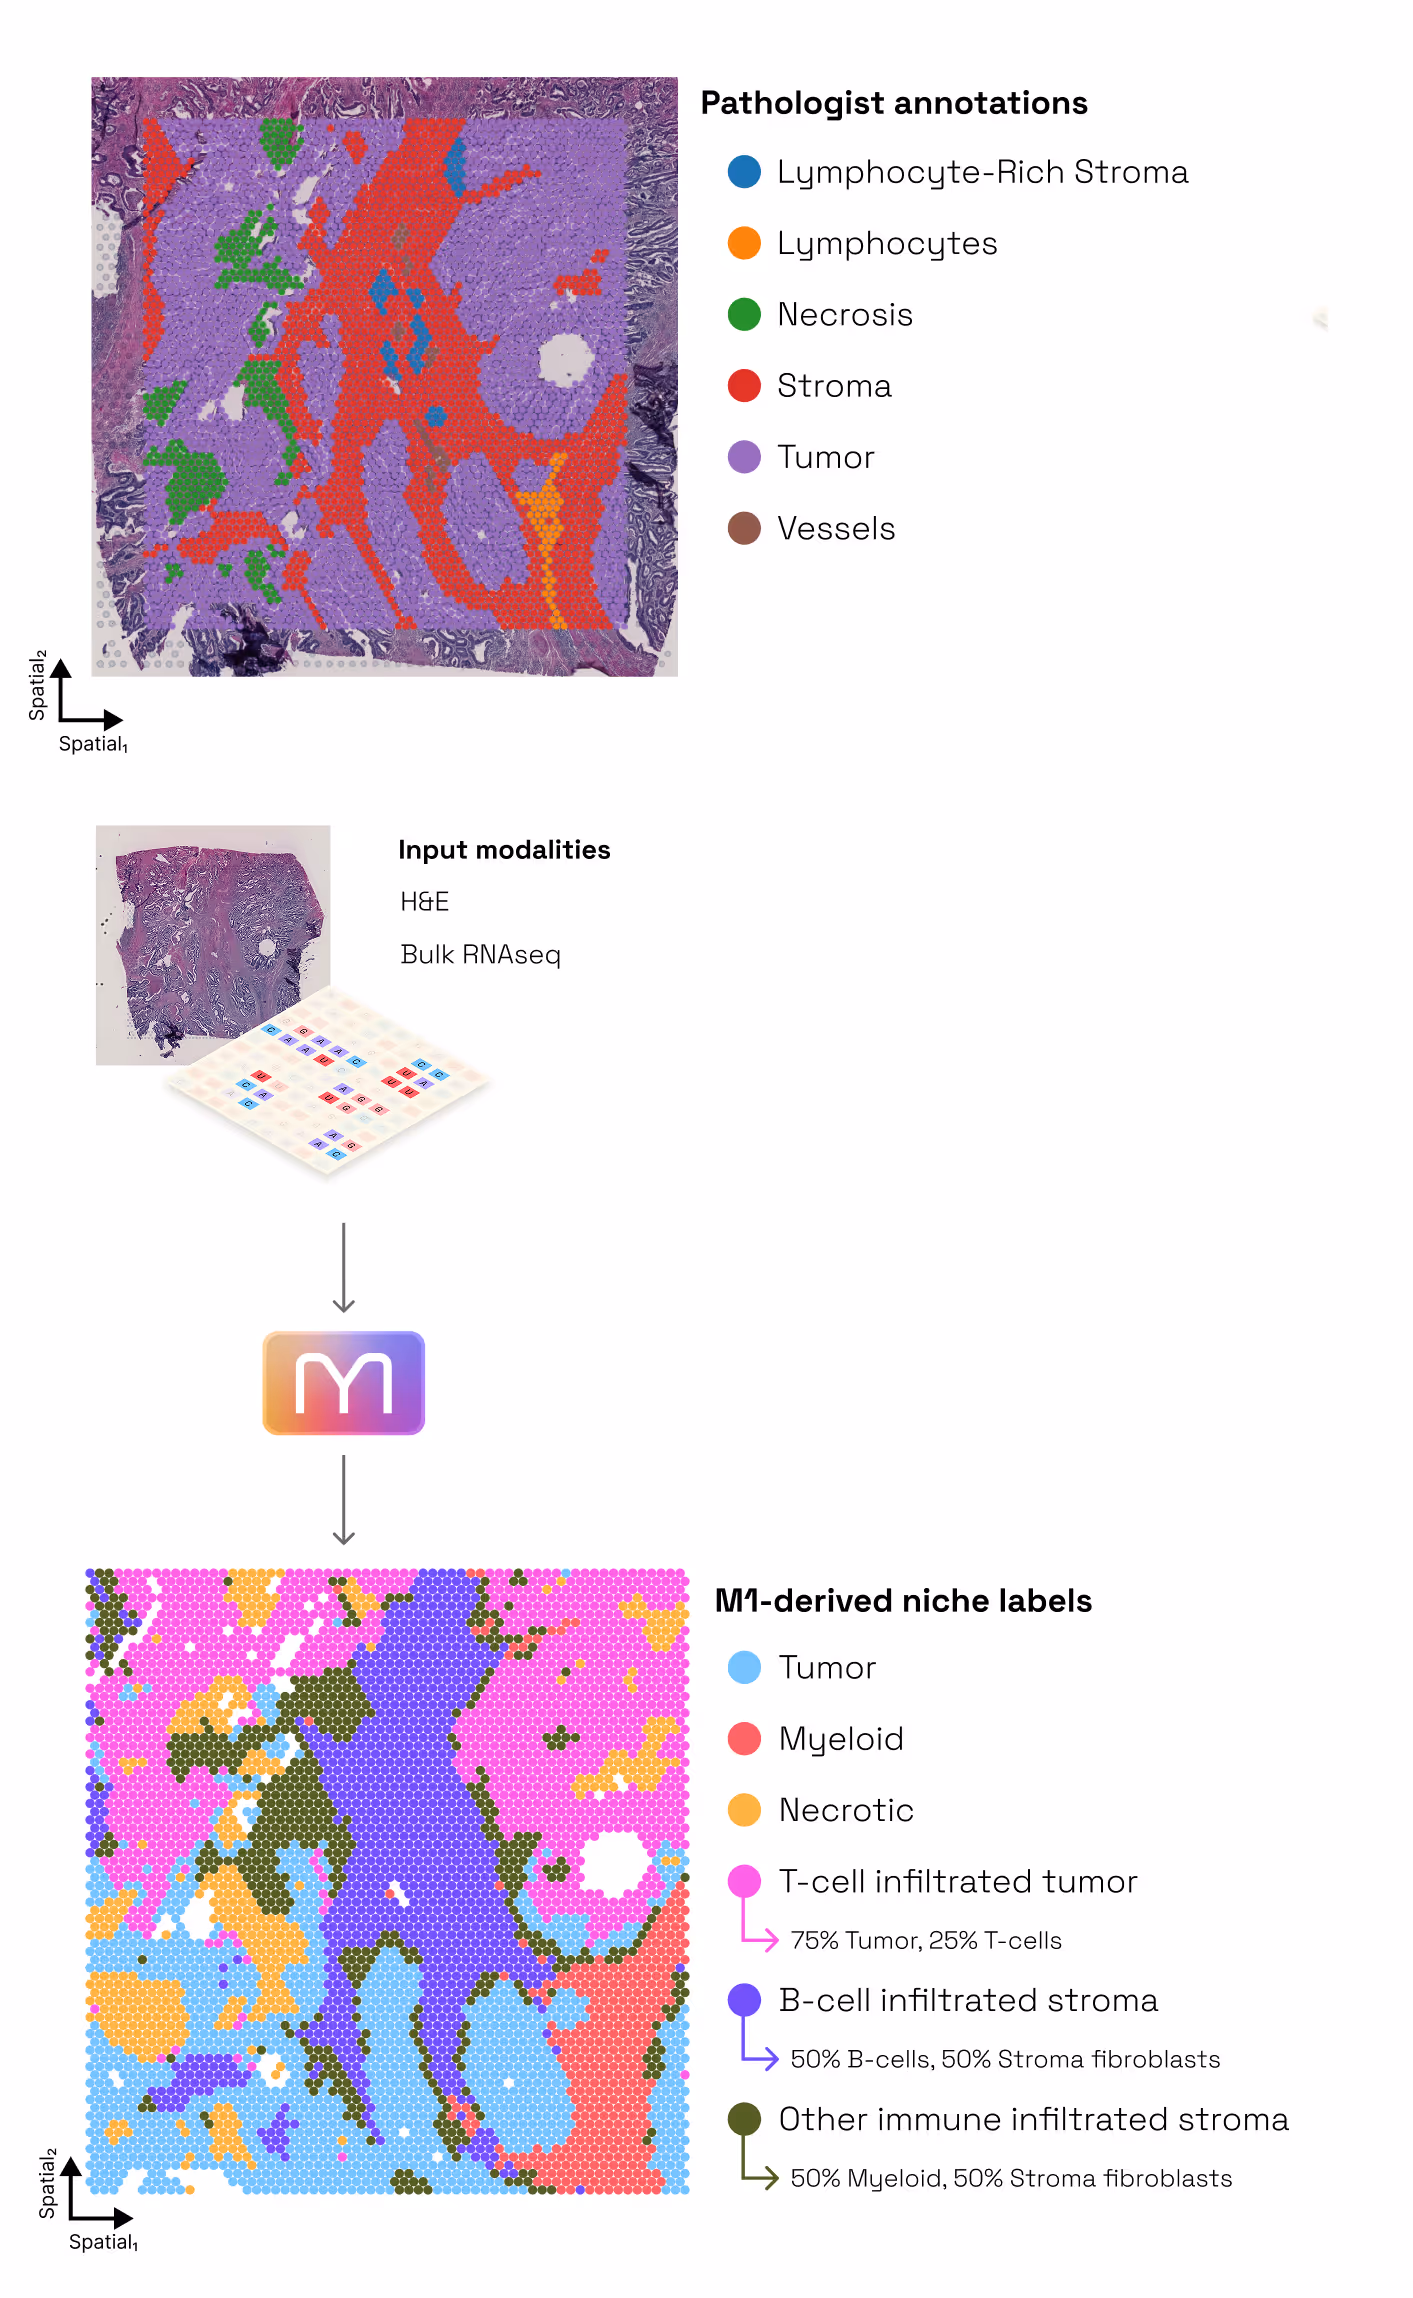
M1 allows researchers to "prime" their experiments with multimodal context. For example, by predicting spatial expression patterns across a whole-slide image first, it allows the user to target downstream micro-dissection or high-res assays to the specific regions of interest identified by the model. Additionally, M1 identifies immune substructures and metabolic niches that are invisible to the human eye, providing a "digital twin" of the tumor microenvironment without requiring additional tissue or staining costs (Figure 9 and deep dive).

Bridging the Gap: From Rare to Common Diseases
05

Because M1 has learned a universal grammar of biology, it allows for "knowledge transfer." Insights gained from a large-scale oncology cohort can be applied to data-sparse rare diseases where tissue samples are precious. This capability is a game-changer for drug repurposing, allowing us to see if the "immune signature" of a successful therapy in one indication is present in another, underserved disease.

Figure 9: M1 enables identification of tumor substructures not identifiable from expert annotated H&E images. In a Colorectal cancer sample: pathologist annotations (left) vs M1-derived niche labels from H&E + bulk RNA-seq (right), resolving T-cell-infiltrated tumor, B-cell-infiltrated stroma, and myeloid-rich regions.
Deep Dive: Tumor microenvironment niche detection
Slide wide gene correlations are a useful measure of model performance, but do not show us if models are capturing local spatial structure. We have started to go beyond simple correlation analysis through unsupervised clustering of model predictions and using routine computational biology techniques to annotate those predictions.
Early work already shows M1 can enrich pathologist annotated slides with detail not previously possible from H&E alone. As an example, on a colorectal cancer sample H&E image plus bulk RNA (courtesy of P. Laurent-Puig and S. Mouillet-Richard, Mouillet-Richard et al., 2026), M1 not only closely matches the pathologist annotations (Tumor stroma, necrosis, etc…), but further refines annotated tumor regions into T-cell-infiltrated tumor, B-cell-infiltrated stroma, and myeloid-rich regions. This will enable researchers to quantitatively investigate important questions relevant to drug development;  how much of the tumor is ‘hot’ vs. ‘cold’, are T-cells infiltrating/excluded, is the stroma enabling or inhibiting immune response, and other spatial dynamics of tumors.
The extra biological resolution is inferred from existing data. Therefore, no new tissue has to be collected from the patient, no wet-lab protocol has to be run, and no additional costs are incurred from high-dimensional assays. We will be sharing more detailed results in future posts.

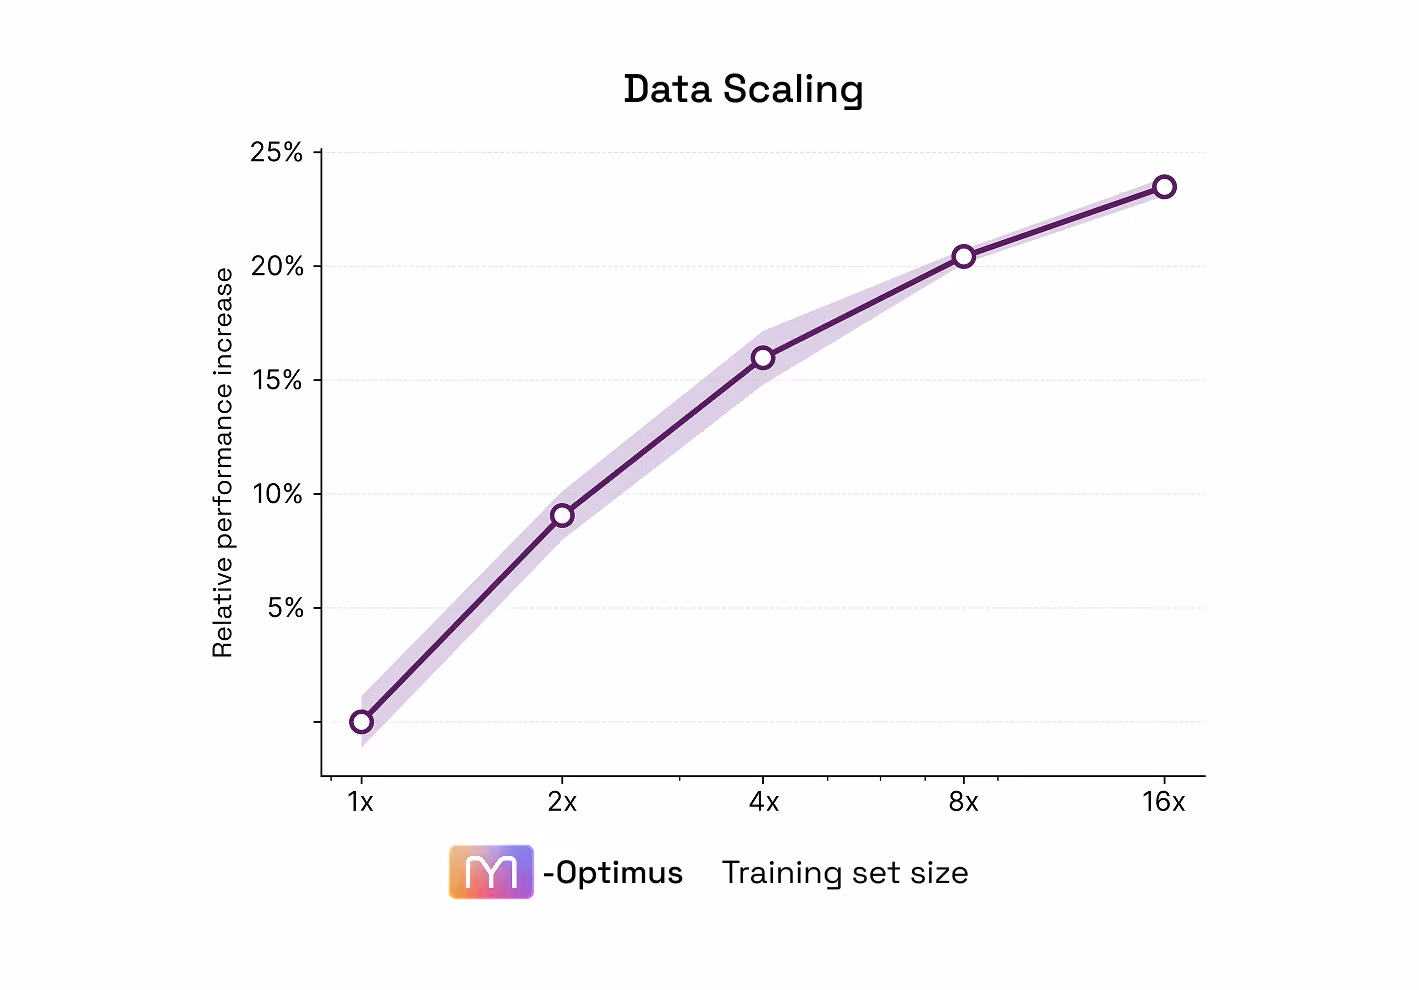
Performance scales with data, and has not plateaued

M1 obeys a clear scaling law: more aligned multimodal data produces a better model, and at our current training scale, performance has not plateaued (Figure 10). The bottleneck is not architecture but rather the availability of high-quality paired multimodal data, which is costly and logistically complex to generate. STELA, our global hospital-partnership program, is built to address this: enabling high-throughput paired multimodal data generation with cutting-edge, high-sensitivity assays across diverse patient populations worldwide.
Figure 10: M1 performance has not plateaued. Relative performance increases as training set size scales from 1x to 16x, with no sign of saturation across three independent model experiments. More data lets M1 get ever closer to the theoretical performance ceiling imposed by the sensitivity of existing spatial transcriptomics assays used for evaluation. 
Deep Dive: Scaling laws
Unlike scaling laws in other domains, most notably LLM pretraining, spatial gene expression prediction performance has a theoretical ceiling due to the intrinsic noise in the data used as the ground-truth reference against which to evaluate predictions.
We evaluated models trained on progressively larger subsamples of the training set, starting from 5% of the available data and doubling repeatedly. Performance scales reliably with volume of training data and does not seem to plateau at our current scale. M1 continues to get ever closer to the theoretical performance ceiling with more training data.
We anticipate that future iterations of the model, supported by even larger and higher quality datasets from our STELA initiative, will push these performance boundaries significantly further. In particular, STELA will massively increase both (1) data availability, helping further close the gap to the theoretical performance ceiling; and (2) assay sensitivity, raising that ceiling itself.

What comes next

The results from M-Optimus-1 validate our vision. Multimodality outperforms unimodality. One general model beats many specialized models. Performance scales with data. Until now, these were theses we held — now each is an empirical result, and they tell us the approach is right. And yet, the most important discoveries M-Optimus will make are still ahead of us.

We are now building the datasets and architecture that will enable the next iterations of M-Optimus:

Better data

Higher-precision spatial transcriptomics through STELA, and more richly aligned datasets with higher sensitivity and at greater scale.

Broader modalities

Extending beyond H&E, bulk RNA-seq, and spatial transcriptomics to capture a more complete biological signal.

Higher resolution

More granular spatial predictions in tandem with new computational approaches.

We have barely scratched the surface. The next post in this series, exploring biological insights, will begin to show why.

In the next post in this series, we go into the biology itself: the use cases M1 is enabling in drug discovery and clinical trial design, how we are validating predictions against real experimental data, and what the model reveals about the parts of the transcriptome that are not legible from an H&E slide alone.

Access

M-Optimus is available now. If you are working on drug discovery, clinical trial enrichment, biomarker discovery, or retrospective analysis of patient cohorts and you’d like to explore what the model can do on your data, contact us.

References

Ganguly K, Kishore U, Metkari SM and Madan T. Immunomodulatory Role of Surfactant Protein-D in a Transgenic Adenocarcinoma of Mouse Prostate (TRAMP) Model. Front Immunol 13:930449, 2022.

Jaume, G., Doucet, P., Song, A. et al. HEST-1k: A Dataset For Spatial Transcriptomics and Histology Image Analysis. Advances in Neural Information Processing Systems 37:53798–53833, 2024.

Mohammadi, A., Inayatullah, M., Schlosser, A. et al. Pulmonary surfactant protein D reduces lung cancer progression associated with decreased IL-4/STAT6 signaling. npj Precis Onc 10:164, 2026.

Mouillet-Richard, S., Cazelles, A., Pilati, C. et al. Profiling colon cancer architecture with spatial transcriptomics identifies clinically relevant stromal ecotypes, Preprint (Version 1) available at Research Square, 2026.

Nonchev, K., Dawo, S., Silina, K. et al. DeepSpot: Leveraging Spatial Context for Enhanced Spatial Transcriptomics Prediction from H&E Images. Preprint medRxiv 2025.02.09.25321567, 2025.

Schmauch, B., Herpin, L., Olivier, A. et al. A deep learning-based multiscale integration of spatial omics with tumor morphology. Nat Commun 16:11674, 2025.

Wang, C., Chan, A.S., Fu, X. et al. Benchmarking the translational potential of spatial gene expression prediction from histology. Nat Commun 16:1544, 2025.